While the bulls seem to be stepping out smartly leaving the bears behind, signs of increasing caution began appearing after the 4th of July holiday. In addition, recent geopolitical events are likely to increase allocations into less risky assets, the ones with substantial liquidity like Treasury Notes and Bonds along with large capitalization stocks while concerns about increasing inflation seems to be diminishing again.
After a short market review including our regular review of futures and options, we update the relationship between the?Consumer Discretionary Select Sector SPDR ETF?(XLY) and theConsumer Staples Select Sector SPDR ETF?(XLP) then look at market breadth and our current long-term interest rate indicator?ProShares Ultra 20+ Year Treasury?(TBT).
Market Review
S&P 500 Index?(SPX) ?as noted last week?after making a new intraday and closing high on July 3, the markets suddenly turned cautious. While a case can be made that a symmetrical continuation pattern is underway it’s hard to ignore the divergence with small capitalization stocks and commodities including crude oil.
iShares Russell 2000?(IWM) ?on July 1 after testing the previous high of 119.81 made on March 4, 2014, closing at 119.56, it abruptly fell apart rapidly declining to below 113 on what seems to technical trading, supported by a desire for less risk and increased liquidity offered by larger capitalization stocks. While some are calling a potential double top, technically a Head & Shoulders Top is possible since the March 4 high at 120.97 was not exceeded on a closing basis July 1 with a 120.08 close. Either way, the neckline needed to set off either pattern is down at 108, both would have measuring objectives down around 95 but only if it first closes below 108.
CBOE Volatility Index??(VIX) ?unsettling geopolitical news Thursday caused a spike above 15, but Friday’s close was slightly less than the week before.
The table below shows the VIX cash compared to the next two futures contracts as well as our calculation of Larry McMillan’s day-weighted average between the first and second months.

The day weighting applies 88% to August and 12% to September for 8.32 % shown above. Our alternative volume-weighted average between August and September, regularly found in the Options Data Analysis section on our homepage, is slightly higher at 9.50%. Thursday the close was -4.84%. We consider premiums less than 10% to be cautionary while the premiums for a normal term structure are 10% to 20%. Premiums above 20% are unsustainable suggesting a lack of enthusiasm for VIX hedging. From a contrary regression to the mean perspective, it suggests complacency.
VIX Options
With a current 30-day?Historical Volatility?of 131.44 and 89.87 using?Parkinson’s range method, the table below shows the Implied Volatility (IV) of the at-the-money VIX calls and puts using the futures prices based upon Friday’s closing option mid prices along with their respective month’s futures prices, since the options are priced from the tradable futures.

Compared to the range historical volatility of 89.87 options are still inexpensive in implied volatility terms. Friday’s volume was 552,106 contracts compared to the weekly average of 839,540 contracts.
CBOE S&P 500 Skew Index?(SKEW) measures the purchase of out-of-the-money S&P 500 Index puts that require a very large downside move to profit from long put positions. An increase of this index indicates greater expectations for an extreme down move. The CBOE explains further, a Skew value of 100 means the perceived distribution of S&P 500 log-returns is normal so the probability of outlier returns is negligible. As Skew rises above 100, the left tail of the distribution acquires more weight increasing the probability of outlier returns.
SKEW had remained relatively stable in the lower part of our arbitrary relevant range of 127.97 defined by the rapid decline to 112.66 on March 14, followed by the spike higher to 143.27 on March 17. On June 19, the situation changed as it advanced 9.08 points to close at 138.61 followed by another 4.65-point advance June 20 to close at 143.26, just under the one-day March 17 spike. Since then it appears to have found a new range defined by 132 on the low side up to 143.26. In the chart below, notice the spike up to 142.28 on July 3 as caution seems to have returned.

In the past, higher SKEW prices have been associated with short-term market tops.
Consumer Discretionary Select Sector SPDR ETF?(XLY) compared to the?Consumer Staples Select Sector SPDR ETF?(XLP). Dividing the discretionary index by the stapes creates a comparative ratio helping to identify the relative flow of funds into these sectors. The discretionary sector usually performs better in the later stages of market cycles while the stapes perform best during early contraction. In the chart below, notice short-term peak made at 151 on July 3 as the consumer staples began increasing relatively once again.

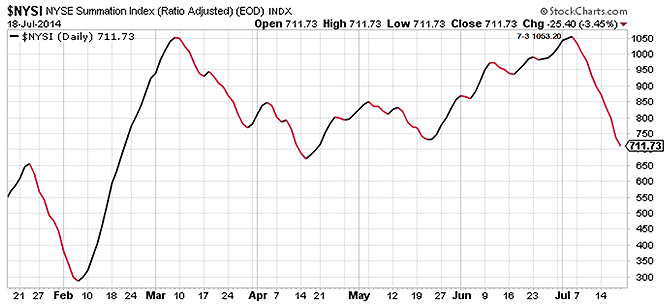
NYSE Summation Index?while we have not been closely following market breadth lately the decline that began on July 3 from 1053.20 is quite noticeable and conforms to the iShares Russell 2000?double top, mentioned above that may be forming.
As a further measure of current risk reduction activity, here is the leveraged long-term Treasury Bond ETF.
ProShares Ultra 20+ Year Treasury?(TBT)?
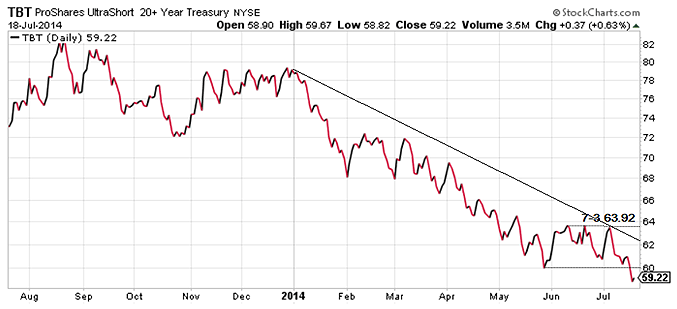
Until the sharp reversal on July 3, it appeared as if long-term interest rates were headed higher but now the breakdown below 60 suggests the downtrend that began at the start of the year will continue. While lower interest rates are normally associated with slowing economic activity this time it may be more about overall market risk reduction since there is no indication from the transports that economic activity will be slowing anytime soon. Indeed the rail report for the week ending July 5 showed very strong growth.
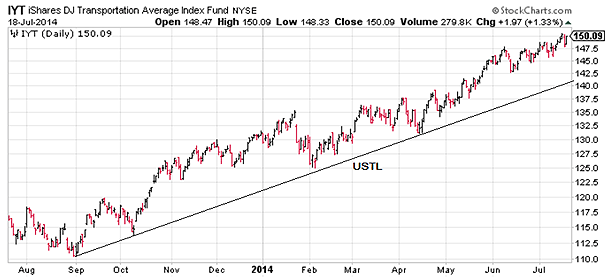
iShares Dow Jones Transportation Average Index?(IYT) 150.09
As one of the most economically sensitive groups that usually outperforms early in market cycles there is no sign here to suggest any economic weakness despite higher crude oil prices.
?
Summary
There was a noticeable change in sentiment after the July 4 holiday, while the S&P 500 Index along with the Dow Jones Transports remained relatively strong small capitalization stocks represented by the iShares Russell 2000?made an ominous decline as Treasury Notes and Bonds advanced creating a sector conflict along with evidence of increased hedging activity.