Cotton Prices Consolidate Near 8-Month Highs
????? Fundamentals
Bucking the trend of lower prices for the so called “softs” commodities, Cotton futures are trading near 8-month highs, as surprisingly strong U.S. exports coupled with lower new-crop planting intentions are keeping the bullish trend alive.
China, the world’s leading consumer of Cotton, has continued to re-stock Cotton inventories despite already ample supplies. Chinese buying represented just over 30% of U.S. weekly old-crop Cotton export sales last week, and cumulative exports sales are running ahead of the 5-year average.
New-crop futures also found some support from a survey from the National Cotton Council, in which U.S. producers were expected to plant just over 9 million areas to Cotton this coming season. This is compared to 12.36 million acres last year, in what was also a down year for Cotton acreage.
Though these fundamentals appear bullish for U.S. Cotton prices, the global picture is not as rosy for the bulls. World Cotton ending stocks rose to a record 81.86 million bales, sharply higher than the just over 69 million bales seen last year. Though China is still a willing buyer of Cotton in the export market, it remains unclear if they will remain as aggressive as they have been, especially with inventories at seemingly ample levels.
Some analysts also note that the March/May old crop spread has moved back into a contango, where more deferred futures months are trading at higher prices than nearby futures. This may signal near-term demand is starting to weaken, which could put pressure on the current bullish move.
???? Technical Notes
Looking at the daily chart for May Cotton, we notice that after a near vertical rise from 75.00 to 80.00, prices have now traded in a narrow 4-cent price range for the past 3 weeks. The past several sessions have seen sellers attempt to test the 20-day moving average, but they have so far been stymied from sending the market lower.
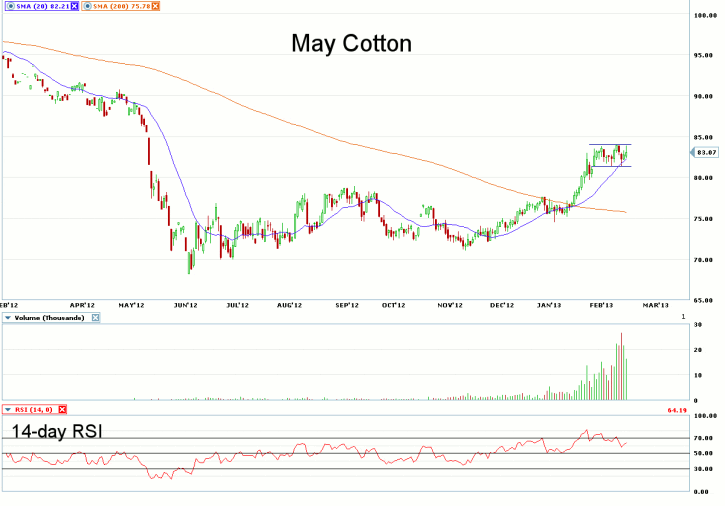
The 14-day RSI has backed away from overbought levels but is still reading a relatively strong 64.19. Support is seen at the chart “gap” formed on January 28th at 81.33, with resistance seen at the top of the recent price range at 84.01.
————————————————————————————-
Disclaimers
This article is provided for informational purposes only. No statement in this article should be construed as a recommendation to buy or sell a security or to provide investment advice. The content provided has been obtained from sources deemed reliable but is not guaranteed as to accuracy and completeness. optionsXpress makes every effort to provide timely information to its recipients but cannot guarantee specific delivery times due to factors beyond our control.
Derivatives involve substantial risk and are not appropriate for all investors. Please read the “”Disclosure Statement for Futures and Options”” prior to investing in futures or options.
For investments using a straddle or strangle options strategy the potential loss is unlimited. Multi-leg option strategies are subject to multiple commissions. Profits may be eroded by the commission expended to open and close the positions and other risks apply.