Another Month, Another Non-farm Payrolls Report
Today’s Spotlight Market
Here are the current estimates for this morning?s employment data for April:
?April Non-Farm Payrolls: 210,000 vs. 192,000 March
?April Private Sector Payrolls 205,000 vs. 192,000 March
?April Unemployment Rate 6.6% vs. 6.7 March
Fundamentals
Once again, it is time for market pundits to polish up their crystal balls and prove their best ?guestimate? for the monthly non-farm payrolls and unemployment report. Traders and analysts are looking for some improvement in the employment picture from last month with some backing from the April ADP National Employment Report that was released earlier this week.
According to ADP, 220,000 private sector jobs were created last month, which was an increase of 11,000 jobs from March. Small businesses accounted for the greatest share of new jobs created at 82,000. Improving weather conditions throughout much of the U.S. allowed the construction industry to ramp-up hiring as 19,000 jobs were created in this important employment sector.
Economic data released on Thursday gave traders mixed signals as to the strength of the U.S. economy, as the Institute for Supply Managers (ISM) reading on the Manufacturing rose to 54.9 in April up from the 53.7 reading in March and above the pre-report estimate of 54.3.?? More importantly, the ISM employment index rose to a 54.7 reading in April vs. 51.1 in March. However, weekly jobless claims rose more than expected last week, adding 14,000 claimants last week to a seasonally adjusted 344,000.
Federal Reserve officials continue to taper back on their bond purchases and provided a rather upbeat assessment of the U.S. economy in the statement following the 2-year FOMC meeting on Wednesday, this despite a measly 0.1% gain in 1st quarter GDP. It appears that the Fed is willing to blame ?Mother Nature? for the dismal growth reading to start 2014, and instead has turned its focus to other economic data that signals stronger economic growth. However, should future economic data not support the Fed?s thesis; it is possible that the Fed will consider temporally suspending its tapering, if U.S. economic growth continues to lag expectations.????? ?
Technical Notes? -? View Today’s Chart
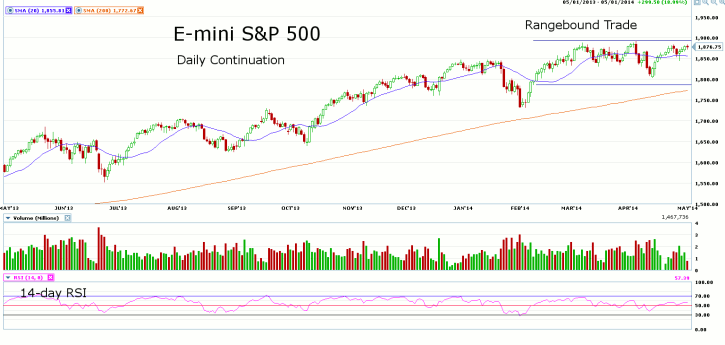
Looking at the daily continuation chart for the E-mini S&P 500 futures, we notice the market treading water since mid-February as the market has been confined within a 100 point range. Prices are currently above the 20-day moving average and momentum as measured by the 14-day RSI is neutral to strong with a current reading of 57.39. 1786.25 looks to be near-term support for the lead-month June futures, with resistance found at the contract high of 1892.50.
———————————————————————————–
Disclaimers
This article is provided for informational purposes only. No statement in this article should be construed as a recommendation to buy or sell a security or to provide investment advice. The content provided has been obtained from sources deemed reliable but is not guaranteed as to accuracy and completeness. optionsXpress makes every effort to provide timely information to its recipients but cannot guarantee specific delivery times due to factors beyond our control.
Derivatives involve substantial risk and are not appropriate for all investors. Please read the?“Disclosure Statement for Futures and Options”?prior to investing in futures or options.
For investments using a straddle or strangle options strategy the potential loss is unlimited. Multi-leg option strategies are subject to multiple commissions. Profits may be eroded by the commission expended to open and close the positions and?other risks?apply.