S&P 500 Remains Near Record Highs Ahead of Payrolls Report
Today’s Spotlight Market
Prior to the release of this morning?s non-farm payrolls and unemployment data for March, traders received some mixed data on the economic front. Early on Thursday, the Labor Department reported that the number of Americans filing for unemployment benefits rose by 16,000 last week to a seasonally adjusted 326,000. This was slightly above estimates and may be a signal that a rebound in hiring due to improved weather conditions is not yet occurring. However, the ISM non-manufacturing Index rebounded in March, with the purchasing Manager Index rising to 53.1, vs. 51.6 in February. More importantly, the employment index rose above 50 to 53.6 in March, after a sharp decline to 47.5 in February.
Fundamentals
Financial traders are once again gearing-up for the always highly anticipated release of the non-farm payrolls and unemployment data for the previous month. The March figures, which will be released at 7:30 AM Chicago time, are expected to show employment rose by 200,000 jobs in March, up from 175,000 jobs created in February. Private sector employment is once again behind job creation, with the ADP National Employment report showing that 191,000 private sector jobs were added in March. This is up from February?s upwardly revised 178,000 jobs created according to ADP data. Weather is expected to have played a factor in hiring last month, as brutal winter weather in January and February may have held back hiring, especially in the construction sector. The unemployment rate is expected to tick lower by 0.1% to 6.6%. E-mini S&P traders will note that the index rallied to new all-time highs just prior to the payroll report?s release, but trading volume has been rather lackluster the past few sessions. This may signal that weak bears are covering short positions prior to the report, with the fear of a much better than expected headline employment number. Equity bulls, however, seem to fear adding to existing long positions with the employment report looming, so we may see some heavier than normal trading volume today as market participants re-enter their positions once the jobs data has been released. ?
Technical Notes? -? View Today’s Chart
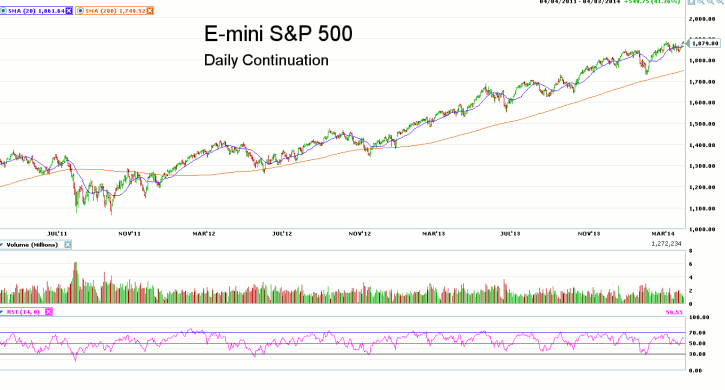
Looking at the daily continuation chart for the E-mini S&P 500 futures, we note that trading volume has been rather light during the recent move towards new-all time highs, which may become disconcerting to momentum-based system traders. Prices have vacillated on both sides of the 20-day moving average for the past 3 weeks, with little excitement by traders as new highs are made. The 14-day RSI remains strong and well below overbought levels, with a current reading of 60.25.? Longer-term, it may take a close below the 200-day moving average to truly signal a downside price correction is in place, but that would currently require a 130-point drop in the S& P Index, which does not appear likely in the coming days. Resistance is seen at 1900.00, with support found at 1830.50.
————————————————————————————————-
Disclaimers
This article is provided for informational purposes only. No statement in this article should be construed as a recommendation to buy or sell a security or to provide investment advice. The content provided has been obtained from sources deemed reliable but is not guaranteed as to accuracy and completeness. optionsXpress makes every effort to provide timely information to its recipients but cannot guarantee specific delivery times due to factors beyond our control.
Derivatives involve substantial risk and are not appropriate for all investors. Please read the?“Disclosure Statement for Futures and Options”?prior to investing in futures or options.
For investments using a straddle or strangle options strategy the potential loss is unlimited. Multi-leg option strategies are subject to multiple commissions. Profits may be eroded by the commission expended to open and close the positions and?other risks?apply.