RBOB Heating-Up Ahead Of Driving Season
???? Today’s Spotlight Market
Gasoline futures have halted the slide that began in mid-February, as some traders’ have become emboldened by the immanent start to the driving season. Inventory levels of Crude Oil remain at multi-decade highs, but there is far more optimism in the US economy than a few weeks ago.
The upbeat assessment of the economy and potential fuel demand could be premature, so longs could be cautious and easily rattled. Technically, the chart shows confirmation of a double-bottom reversal pattern, but prices have stalled since confirmation. Ideally, some traders would like to see more follow-through here as further confirmation.
???? Fundamentals
RBOB Gasoline futures seemed to have found stability above the 2.700 level ahead of Memorial Day, which is considered the start of driving season. Some traders have become more optimistic that the US is separating from the pack and on track to have moderate economic growth this year.
Yesterday’s EIA report showed Cushing, OK stocks falling 652,000 barrels, but rising 230,000 barrels,overall in the US. The drawdown in Gasoline inventories was 900,000 barrels, which is more than the analyst estimate of 500,000 barrels. The inventory data gave RBOB bulls a shot in the arm and caused the WTI/Brent Crude Oil spread to momentarily trade down to 7.77.
The enthusiasm could be short -lived, though, after traders dive deeper into the numbers. Crude Oil production is rising once again, and Gasoline inventories averaged 8.5 million barrels a day over the past month. While the Gasoline inventory stocks are down 2.4% versus last year, there are more than adequate supplies, barring an unforeseen spike in demand. Refinery runs were 87% of capacity, up over the prior week. Refining capacity should continue to increase, as seasonal maintenance work is basically completed.
???? Technical Notes
Turning to the chart, we see the June RBOB contract confirming a double-bottom formation. The measure of the pattern suggests prices could test the mid to high-2.90’s. There is scattered congestion on the chart around the 2.9000-2.9250 area, which could act as resistance. The recent closes above the 20-day moving average suggest that a near-term low may be in place.
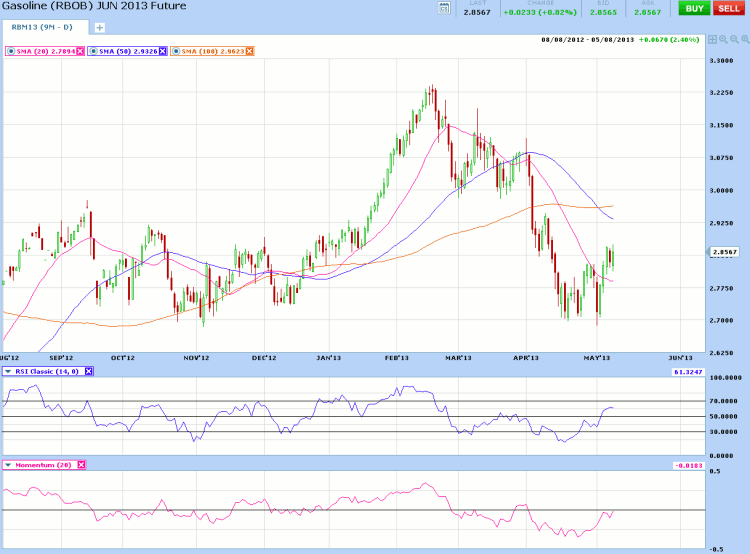
The momentum indicator is just below the zero line. Crossing into the positive could be seen as bullish. The RSI indicator is currently in neutral territory, but threatening to push into oversold levels, which can be seen as neutral to bearish.
————————————————————————————–
Do you want to learn more about unusual options trading activity? Then the Unusual Options Activity Forum is for you:
When: Wednesday, May 15
Time:? 2:00 p.m.
Where: The Chicago Board Options Exchange, 400 South LaSalle Street, Chicago, IL 60605
Price: $99
What Will You Learn?
Attendees of this one-of-a-kind event will learn:
- The specific tools, strategies, and techniques used by options experts to identify unusual options trading activity
- How to filter out meaningful trades from the sea of noise in the options market
- How to successfully incorporate unusual activity information into your options trading
- How to avoid the costly mistakes made by many traders when analyzing unusual options activity.
What Will You Get?
- A Rare, Guided Tour of the Historic Chicago Board Options Exchange Trading Floor ? Including the Apple, Google, SPX & VIX Trading Pits (street price: unavailable to the public)
- One Free Month of Option Vision ? ?A unique 3-D charting platform designed to hunt down unusual options activity (street price: $99)
- One Free Month of OptionAlert ? The leading option flow monitor and unusual activity analysis tool (street price: $150)
- One Free Month of Livevol Pro ? The premiere analytics platform for professional options traders (street price: $199)
- Free Copy of The Options Traders? Hedge Fund (street price: $40)
- One Free Month of Option Pit Live ? Option Pit Live is designed to feed option traders the best actionable options trading content on the web. (street price: $125)
- One Free Month of Market Taker Group Coaching ? Let the pros at Market Taker Mentoring improve your options trading. Receive professional daily group mentoring sessions for one month ? including 20 trade ideas each session. (street price: $332)
———————————————————————————
Disclaimers
This article is provided for informational purposes only. No statement in this article should be construed as a recommendation to buy or sell a security or to provide investment advice. The content provided has been obtained from sources deemed reliable but is not guaranteed as to accuracy and completeness. optionsXpress makes every effort to provide timely information to its recipients but cannot guarantee specific delivery times due to factors beyond our control.
Derivatives involve substantial risk and are not appropriate for all investors. Please read the “”Disclosure Statement for Futures and Options”” prior to investing in futures or options.
For investments using a straddle or strangle options strategy the potential loss is unlimited. Multi-leg option strategies are subject to multiple commissions. Profits may be eroded by the commission expended to open and close the positions and other risks apply.