In the recent Credit Suisse Global Investments Return Year 2013 report, it shows how the VIX?recovered from crisis-related spikes.
Analysts wrote in the report:?
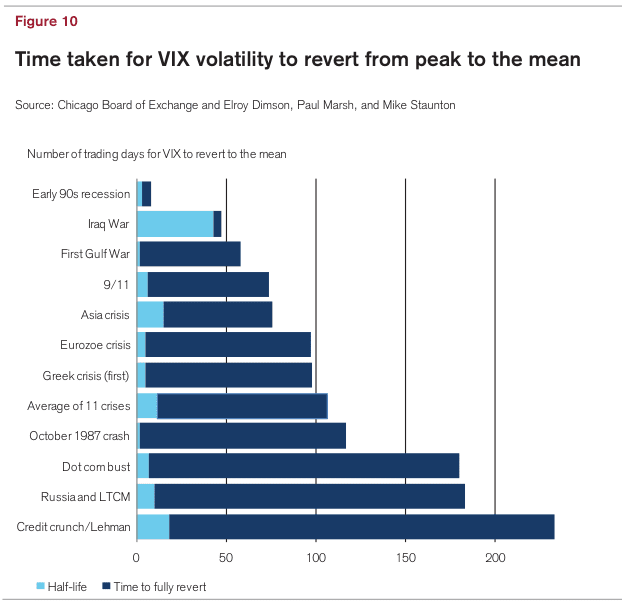
In the Sourcebook, we identify 11 major spikes in the VIX, each associated with an economic or political crisis. For each crisis, Figure 10 shows the time taken in trading days for the VIX to revert from its peak volatility back to its (then) long-run mean. The longest reversion time was during the credit crunch/Lehman crisis, when it took 232 trading days (11 months). The average time was 106 trading days, or just under five months. Figure 10 also shows the ?half-life,? or the time taken to revert half the way back to the mean. The average half-life was just 11 days.
In addition to varying with the level of risk in the markets, the equity premium will also vary over time with investors? risk aversion. After sharp market declines, equity investors are poorer and more risk averse. At such times, markets are also typically more volatile and highly leveraged. Investors should therefore demand a higher risk premium (which will drive markets even lower) in order to ensure that stocks are then priced to give a higher future expected return.
?