Strategy Review
S&P 500 Index?(SPX) After a dramatic 38.17-point decline on January 24, the picture changed from what had been a slight “buy the dip” pullback to something more serious. From a classical bar chart perspective, a Hydra Head & Shoulders Top could be emerging with the potential neckline just below 1775. First, it needs to rebound to form the missing right shoulder up near the current resistance 1818.52 before declining again to set off the pattern with a close below the neckline. If so, the downside-measuring objective is 1687. However, this is an unusual top pattern so surely not all analysts agree with this interpretation. Take a look at the chart.
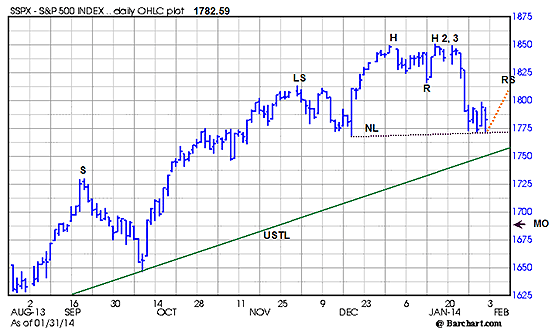
Keeping the clutter to a minimum here are the numbers corresponding to the labels above.?LS?is the potential Left Shoulder high at 1813.55 made November 29.?H?is the first possible Head made at the December 31 high of 1849.44.?H2?is the January 15 high at 1850.84, followed by?H3,?the high of 1849.31 made January 21.
NL, the dotted line, is the Neckline running between the December 18 low of 1768.36 and the January 29 low at 1770.20.?R?is the upside resistance and a likely target for any possible rebound. The orange dotted line represents the expected upward path that would form the missing?RS, Right Shoulder.
MO?at 1687 marks the estimate downside Measuring Objective, obtained by measuring the distance between the top and neckline and then subtracting it from the neckline.
In an ideal symmetrical chart world, a rebound up to form the Right Shoulder should begin shortly, but the pattern could still be intact if it first continues lower before attempting to rebound, as it would simply lower the slope to the Neckline while also lowering the ultimate downside-measuring objective as well. This is a real possibility since the current operative upward sloping trendline?USTL,?in green above from November 16, 2012 low of 1343.35, now crosses at 1751 and makes a tempting downside target for the shorts. In the event the USTL fails to hold the decline then the next support is the September 19 high at 1729.20 marked?S?above at the left.
For those who may not agree with the potential Head & Shoulders Top interpretation, there is little doubt about an alternative now completed double top pattern and the upward sloping trendline that is the next support level to the tested.
E-mini S&P 500 Futures?(ESH4) One way to measure trend momentum is to watch open interest since it needs to keep expanding to sustain the move. In?”Forecast Record Review” we concluded as of January 16, there had been no evidence of declining open interest.
Now updating the record to last Thursday January 30 we see open interest was 2.917 million, an increase of 20,306 contracts or .7% as the March Futures contract declined 3%. While there were declines both last Wednesday and Thursday, we would have expected a net decline over the period when the price was declining.
CBOE Volatility Index??(VIX) Since our last review, ?VIX rocketed higher, increasing from 12.44 as the market declined.
The table below shows the VIX cash compared to the next two futures contracts as well as our calculation of Larry McMillan’s day-weighted average between the first and second months.
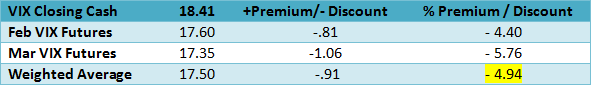
The day weighting applies 60% to February and 40% to March for an average negative premium of 4.94% shown above. Our alternative volume-weighted average between February and March, regularly found in the Options Data Analysis section on our homepage, is slightly higher at – 4.86%. The negative premium indicates an inverted and unsustainable term structure that will revert to a normal positive premium as the S&P 500 Index makes a pivot and turns higher after the correction ends. For comparison, on January 24, the day the S&P 500 Index declined 38.17 points, the premium as -10.69%.
VIX Options
With a current 30-day?Historical Volatility?of 120.96 and 81.05 using?Parkinson’s range method, the table below shows the Implied Volatility (IV) of the at-the-money VIX calls and puts using the futures prices based upon Friday’s closing option mid prices along with their respective month’s futures prices, since the options are priced from the tradable futures.

All of the Implied Volatilities along with the Historical Volatilities and Greeks for the VIX options based upon the futures prices are on our?Advanced Options?page, found by clicking on the “?market close” link shown near the top of the page.
CBOE S&P 500 Skew Index?(SKEW) ?SKEW measures the purchase of out-of-the-money S&P 500 Index puts that require a very large downside move to profit from long put positions. An increase of this index indicates greater expectations for an extreme down move.
Now just below the midpoint of the current relevant range between the November 6 low of 118.69 and the December 20 high of 143.19, it reflects declining hedging activity with out-of-the-money puts by those who correctly anticipated a correction and are now reducing their positions. We will probably see it back around 120 or lower before the S&P 500 Index correction is completed.
US Dollar Index?(DX) After taking a blow on the December employment report released January 10 and again January 23, the dollar appears headed back toward resistance at 81.50, most likely spurred high by confirmation the Federal Reserve will continue reducing bond purchases thereby reducing the supply of dollars in circulation around the world.
10-Year Treasury Notes?(TNX) yield 2.66% after reaching 3.03 on December 31. The uptrend defined by the upward sloping trendline from the October 30 low of 2.47 and the December 18 low at 2.82 was decisively broken on January 10 with the disappointing December employment report that was much lower than expected. Indeed some analysts even declared it was a mistake expecting a revision higher for the January report that will released Friday. If the report disappoints again interest rates will quickly retest the October 30 low.
iShares Dow Jones Transportation Average Index?(IYT) The very next day after making both a new high at 135.93 and a new closing high of 135.54 on January 23, it abruptly gapped lower to close below the upward sloping trendline that starts at the October 9 low of 114.49 touching the January 6 low at 129.11, thereby confirming the correction underway in the Dow Jones Industrial Average.
NYSE McClellan Summation Index?Last week our preferred breadth indicator declined 179.50 making the two week decline 141.59 points. For now any previously expected outperformance by small capitalization stocks is on hold at least until the current correction has run its course.