As we prepare to close out the year with the S&P 500 Index up 29% signs are starting to appear that the world economy may be on the verge of improving thus confirming the advance has been more than just price to earnings multiple expansion. Indeed selected rising commodity prices along with interest rates could be early confirmation of an improving economic picture going into 2014.
Market Review
S&P 500 Index?(SPX) In our last review?we noted a potential Head & Shoulders Top with a minimum measuring objective down at 1747. Since then, the upside reversal on December 18 with a 29.65 point advance followed by another 8.72 advance on December 20 to close above the potential Head cancels the potential pattern and the advance continued into new high territory once again. While not yet overbought there were some signs of profit taking in some widely followed momentum names Friday.
CBOE Volatility Index??(VIX) Since our last review?VIX rapidly declined as expected on the December 18 SPX taper announcement advance to reach a low of 11.69 Thursday.
The table below shows the VIX cash compared to the next two futures contracts as well as our calculation of Larry McMillan’s day-weighted average between the first and second months.
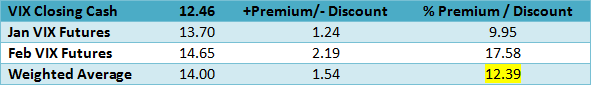
The day weighting applies 68% to January and 32% to February for an average premium of 12.39% shown above. Our alternative volume-weighted average between December and January, regularly found in the Options Data Analysis section on our homepage, is slightly higher at 12.66%. Premiums in the ten to twenty percent range reflect a normal Futures term structure consistent with an advancing market unconcerned with a near term decline.
VIX Options
With a current 30-day?Historical Volatility?of 78.59 and 62.94 using?Parkinson’s range method, the table below shows the Implied Volatility (IV) of the at-the-money VIX calls and puts using the futures prices based upon Friday’s closing option mid prices along with their respective month’s futures prices, since the options are priced from the tradable futures.
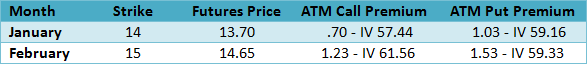
The relatively low Implied Volatility Index Mean (IVXM) 51.78 is below both Historical Volatility measures for a .66 ratio and .82 using the range method for Historical Volatility.
All of the Implied Volatilities along with the Historical Volatilities and Greeks for the VIX options based upon the futures prices are on our?Advanced Options?page, found by clicking on the “market close” link shown near the top of the page.
US Dollar Index?(DX) Despite modest tapering announced by the Federal Reserve on December 18, the dollar continues testing the lower end of its recent range with support at 79.75 and resistance in the 81-81.50 area. Although interest rates advanced, the dollar is not yet reflecting strength and even tested the lower end of the range Friday. Perhaps the lack of strength is more about year-end euro strength than dollar weakness.
10-Year Treasury Notes?(TNX) yield 3.01% above the September 5 resistance high of 2.98%. However, the dollar has yet to reflect the higher rate and key commodity prices are moving higher including WTI crude oil, and copper confirming the stronger economy scenario.
iShares Dow Jones Transportation Average Index?(IYT) ?Avoiding any potential divergence the transports continued advancing along with the S&P 500 Index despite higher crude oil prices adding further confirmation to the strengthening economy story.
NYSE McClellan Summation Index? After the Federal Reserve taper announcement breadth slowly began improving by advancing 40.77 points for the week ending December 20 and then another 204.43 points last week as breadth momentum picked up. However, it is still much lower than it was May 17 when the NYSE Composite was 776.83 points lower. This divergence continues to be a concern, as more money is concentrated in fewer issues. If the market begins reflecting better economic conditions, breadth should continue improving.
CBOE S&P 500 Skew Index?(SKEW) ?SKEW measures the purchase of out-of-the-money S&P 500 Index puts that require a very large downside move to profit from long put positions. An increase of this index indicates greater expectations for an extreme down move.
As the VIX declined after the December 18 taper announcement out-of-the-money put activity increased as SKEW advanced to a high of 143.19 on December 20 the highest level in more than a year as professional hedgers used declining implied volatility to buy some put protection for their long portfolios. At the close Friday, it was 10.50 higher than our last report.