?Metal Mania? Making a Comeback?
Today’s Spotlight Market
Gold?s recent positive performance comes despite physical demand rising only slightly above sales in June. Gold?s 6.2% price gain in June kept buyers at bay but spurred some physical selling by weak longs taking advantage of the price rally. However, better than expected Jobs data from the June non-farm payrolls report sent Gold prices lower to end the holiday shortened week as the Dollar and U.S. Treasury yields rose, which are usually a toxic potion for Gold prices.? ?
Fundamentals
Don?t look now but one of the least loved commodity sectors by trader and analysts to start 2014? Precious Metals, are starting to display rather bullish price moves. Leading the Charge has been Palladium, with prices trading near its highest levels in nearly 3 years on tight supplies and improving auto sales. Palladium?s use in auto catalyst for gasoline powered vehicles is by far the largest use of this precious/industrial metal. However, some of the biggest surprises are in the performance of Gold and Silver of late. Here, analysts note that Gold ETF purchases have increased and now stand at their highest levels since mid- April, as buyers are starting to turn once again towards Gold as a diversification from equities and bonds due to rising global tensions especially in the Middle East, as well as, a potential hedge against rising inflation. Even the Base Metals sector is starting to show some support, especially Aluminum, Zinc and Copper. Traders view a potential Chinese economic rebound, which is being spurred by data showing manufacturing expanding at its fastest pace so far this year, along with continued improvement in U.S employment, which may encourage expansion in the industrial sector and in turn help support demand for industrial metals.
Technical Notes? -? View Today’s Chart
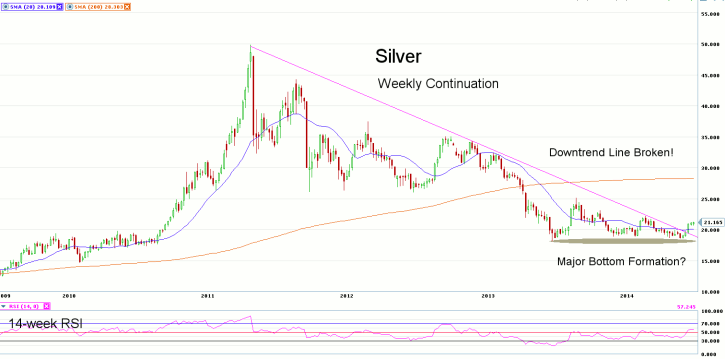
Looking at the weekly continuation chart for September Silver, we notice what appears to be a longer-term bottom forming as prices have found strong support just above the 18.000 price level. In addition, we note that prices are now above the downtrend line drawn from the major 2011 highs when prices failed at a test of the 50.000 price level.? The market is trading above the 20-week moving average (MA), but remains well below the 200-week MA, which is currently at 28.30. The 14-week RSI has turned positive, with a current reading of 57.24. 22.180 is seen as the next resistance level, with support found at 18.620.
———————————————————————————————
Disclaimers
This article is provided for informational purposes only. No statement in this article should be construed as a recommendation to buy or sell a security or to provide investment advice. The content provided has been obtained from sources deemed reliable but is not guaranteed as to accuracy and completeness. optionsXpress makes every effort to provide timely information to its recipients but cannot guarantee specific delivery times due to factors beyond our control.
Derivatives involve substantial risk and are not appropriate for all investors. Please read the?“Disclosure Statement for Futures and Options”?prior to investing in futures or options.
For investments using a straddle or strangle options strategy the potential loss is unlimited. Multi-leg option strategies are subject to multiple commissions. Profits may be eroded by the commission expended to open and close the positions and?other risks?apply.