Grain Traders Await USDA Acreage Report
Today’s Spotlight Market
The following are the average estimates for U.S. Grain and Soybean Plantings:
???????????????????????????? Current Estimate???????????????????????? March 31st Estimate
Corn???????????????????? 91.787 million acres??????????????????? 91.691 million acres
Soybeans??????????? 82.173 million acres??????????????????? 81.493 million acres
Spring Wheat????? 11.947 million acres??????????????????? 12.009 million acres
Fundamentals
Grain traders were busy squaring their positions last week in anticipation of the USDA Planted Acreage and Grain Stocks report due out at 11 am Chicago time this morning.? Here is a summary of what traders are focusing on in this report:
Corn: Traders are anticipating a modest increase in planted acreage for Corn from the March report, with average expectations of 91.787 million acres planted. Weather conditions have been good so far this year for the emerging Corn crop, so a figure north of 91.8 million acres would be considered fairly bearish for new-crop Corn. Analysts have a very mixed opinion as to the size of U.S. Corn supplies as of June first with estimates ranging for a low of 3.045 billion bushels to just over 4.05 billion bushels! However, U.S. Corn inventories will still be sharply higher YoY from the 2.766 billion bushels last June.
Soybeans: A large Soybean crop is anticipated this season as U.S. growers are expected to have planted a record amount to Soybeans. The question is how large will the Soybean acreage turn out to be? Analysts are expecting U.S. Soybean acreage to total 82.173 million acres up from 81.493 million acres in the March report, although there are some thoughts that over 83 million acres may have been planted.? Soybean inventories are expected to total 390 million bushels as of June 1st vs. 435 million bushels last year.
Spring Wheat: Producers in the Northern Plains are expected to have planted fewer acres towards Spring Wheat than originally forecast, with the average estimate falling by slightly to 11.947 million acres vs. 12.009 million acres in March. Statistics Canada reported on Friday that Spring Wheat acreage totaled 17,636 million acres vs. 19,043 million acres in 2013.
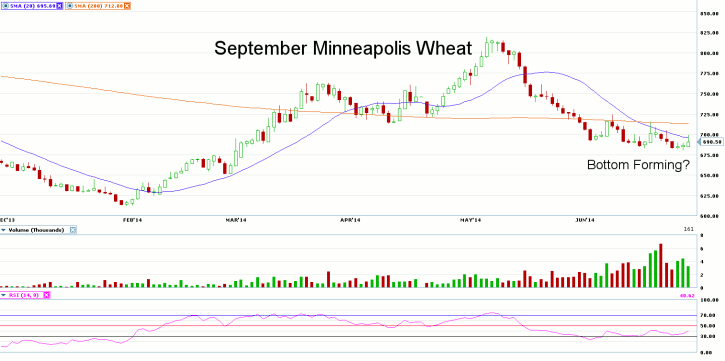
Technical Notes? -? View Today’s Chart
Looking at the daily chart for September Minneapolis Wheat (MWU14), we notice what looks like a potential bottoming formation as prices appear to be putting in a floor just above 680.00. In addition, we are starting to see what may be a bullish divergence in the 14-day RSI as this momentum indicator has formed a bottom prior to the recent lows made in the futures.? 680.50 is seen as support for the September contract, with resistance found at the June 9th high of 724.25.
—————————————————————————————-
Disclaimers
This article is provided for informational purposes only. No statement in this article should be construed as a recommendation to buy or sell a security or to provide investment advice. The content provided has been obtained from sources deemed reliable but is not guaranteed as to accuracy and completeness. optionsXpress makes every effort to provide timely information to its recipients but cannot guarantee specific delivery times due to factors beyond our control.
Derivatives involve substantial risk and are not appropriate for all investors. Please read the?“Disclosure Statement for Futures and Options”?prior to investing in futures or options.
For investments using a straddle or strangle options strategy the potential loss is unlimited. Multi-leg option strategies are subject to multiple commissions. Profits may be eroded by the commission expended to open and close the positions and?other risks?apply.