Pinnacle For Pork Prices In Place?
Today’s Spotlight Market
Large Speculators have been eager bulls in the Lean Hog futures market, following the trend higher as prices made new-all time highs. However, we have started to see some resistance to adding to the already large net-long position last week, despite rising prices. The most recent Commitment of Traders report showed that non-commercial traders trimmed their net-long position by 1,151 contracts during the reporting period ending June 10th. This leaves the non-commercial net-long position at 71,417 contracts, which remains near extreme levels. Trading may become choppy the next several sessions as market participants cover positions ahead of the quarterly hogs and pigs report due out after the close of trading on Friday, June 27th.
Fundamentals
The historic bull market in Lean Hog futures appears a bit long in the tooth as prices begin to show signs of a near-term top. 2014 Futures prices started the week sharply lower following a decline in wholesale pork prices on Friday. Pork production was up 3.4% last week according to the USDA, as higher Hog weights more than made up for fewer hogs being sent for processing. Traders are also becoming concerned that the premium of nearby futures prices to the cash index has become excessive at over 17 cents per pound for the August futures versus an historical average of closer to 2 cent per pound for this time of year. Hog producers are expected to take advantage of near-record cash Hog prices and the potential for sharply lower feed costs going into 2015 to expand the size of the Hog herd, which has been decimated by the outbreak of the PEDv virus in the U.S.? This potential increase in the supply of Hogs could finally put an end to rising cash market prices later this year, as packers may become hesitant to aggressively bid for supplies with the potential for lower prices as more Hogs are moved to market in the coming months.
Technical Notes? -? View Today’s Chart
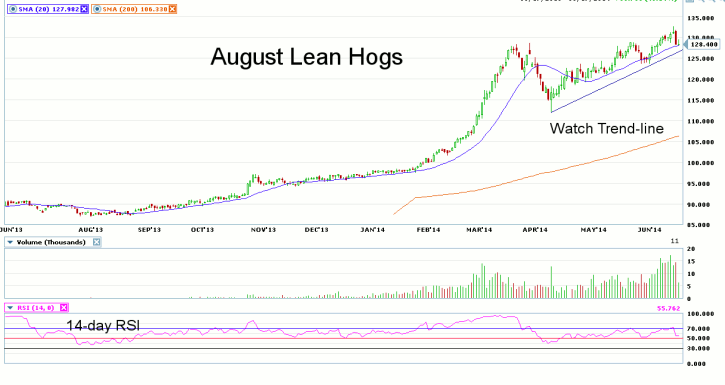
Looking at the daily chart for August Lean Hog futures, we notice a ?reversal? pattern forming in the daily chart as this past Friday closed well off contract highs and was followed by a near-limit down move on Monday. There is a major bearish divergence forming in the 14-day RSI and the indicator itself has fallen from overbought reading to a much more neutral 55.33. Monday?s steep price sell-off has prices holding just above the 20-day moving average, with a close below this widely watched indicator, setting up a potential move toward support at the recent low of 123.725. Resistance is seen at the contract high of 132.650.
————————————————————————————
Disclaimers
This article is provided for informational purposes only. No statement in this article should be construed as a recommendation to buy or sell a security or to provide investment advice. The content provided has been obtained from sources deemed reliable but is not guaranteed as to accuracy and completeness. optionsXpress makes every effort to provide timely information to its recipients but cannot guarantee specific delivery times due to factors beyond our control.
Derivatives involve substantial risk and are not appropriate for all investors. Please read the?“Disclosure Statement for Futures and Options”?prior to investing in futures or options.
For investments using a straddle or strangle options strategy the potential loss is unlimited. Multi-leg option strategies are subject to multiple commissions. Profits may be eroded by the commission expended to open and close the positions and?other risks?apply.