Being a probability based trader, I always teach how the implied volatility of an option at a particular strike can be used to calculate the probability of profit.? And, in general, this is a (reasonably) true statement.? However, we must remember that the prices of options and their probabilities are based on the assumption that the distribution curve is relatively normally distributed.? This is true whether we use a Black-Scholes, a binomial, or a Monte-Carlo based model.? We know that these distributions may have a skew and/or a kurtosis, but we are able to account for that in our probabilities.
Are there stocks that seemingly every time you sell premium in them, they blow up in your face?? You seem to lose far more times than you win?? Maybe that stock is NFLX for you, or AMZN.? Did you ever stop to think it might not be your imagination??? So, why might this happen???
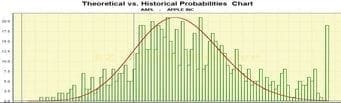
Now for the heretical part?.? Not all stock?s distribution curves are normally distributed!? Some have far more outliers (or fatter tails) than predicted by the options? IVs.? I believe AAPL is just such a stock.? Take a look at the following chart.? It is the last three years of data from AAPL.? The green bars are actual stock movements and the red curve is the distribution curve defined by the current IV per strike.? As you can see, there are far more outlier moves than are predicted by the options prices.?
?
I dug a little further.? I did a 12 month study where I looked at what would have happened had I purchased a single straddle with 31 days to expiration.? First, I looked to see what would have happened if I bought the straddle and let it expire.? For the one year period, I would have lost $1,866.? Not too promising.? But, next I looked to see what the range of the stock was from the time I bought the straddle until it expired.? I compared this range to its straddle price when purchased.? This equates to selling the call for intrinsic value at the top and selling the put for intrinsic value at the bottom.? In this case, I would have made $37,880.? Now, that?s a bit better.? A little unrealistic, but much better!? Now, I cut it down to see if the stock ran in any one direction beyond the price of the straddle.? This is a bit more realistic, as if the intrinsic value on one of my options exceeds the price I paid for the entire straddle, I would most likely take profits at some point.? For example, if I bought the $500 straddle for $30 and the stock subsequently ran to $540, I would most likely take profits when I felt the stock had turned back down either by selling the call or by selling stock.? And, by only accounting for intrinsic value, I balance off some slack due to not being able to actually sell the high or buy the low vs. the extrinsic value I might have captured (if I sold the option).? In fact, it did exceed the straddle price in one direction 10 of the 12 months.? And, if I took profits when it did, I would have made $21,592!
As I said, AAPLs IV is near its 52 week low.? Its March ATM straddle is trading for 5.06% of its stock price.? In only one of the twelve months was it cheaper and that was on November 19, 2013 when it traded for 4.77%.? Its high price was 8.63% of the stock price on April 16, 2013.? So, not only does the strategy hold promise no matter what the IV is at the time of purchase (remember, ten wins out of 12), but we are at the low end of the IV range.
The last piece of information to look at is the stock?s HV (historical volatility).? Though the 20 day (industry standard) HV is currently 34.78 (making a 21 IV look like a steal), the 10 day HV is 11.26 and the 5 day HV is 12.65.? Does that change my opinion on the buy?? As I have explained before, when a stock is trending in either direction in a fairly consistent fashion, as AAPL has the past 11 days, HV may be misleading.? I am encouraged by the fact the stock has moved around $50 in the last 11 sessions while the straddle I am buying is trading for $27.50.
A layup straddle buy?? Not by any means.? But, I look for good probability trades wherever I find them.? And, I am not constrained by the probabilities produced by the IV of the option chain.? Sometimes, these can be misleading!? I look to the historical distribution of stock prices for clues as to when it is appropriate to stray from the ?rules?.??