While we expected the S&P 500 Index would finally overcome resistance at 1850, in Elliott Wave terms the market was living on borrowed time and like crossing Niagara Falls on a high wire, any unforeseen gust of wind from the right or left would result in disaster. Well on Thursday, an unforeseen wind began, not from earnings reports, but from China overcoming the trade winds to blow West through Turkey and finally Argentina, taking all of the markets with it. Now instead of looking for new long ideas we are scrambling to manage existing positions and opens hedges anticipating more downside.
After a brief market comment, we have two hedge ideas one using the?CBOE Volatility Index??(VIX), the other for?iShares Russell 2000?(IWM).
Market Review
S&P 500 Index?(SPX) was down 48.41 or – 2.63 % for the week. As we observed in,?”New Year Market Forecast,” 1850 was not only resistance but also the lower end of the current Elliott 5th Wave objective range between 1850 and 2033. In the absence exogenous negative macro forces from the emerging markets, it may have been able to overcome resistance at 1850 since the majority of the companies in the index that had reported so far had beaten earnings and revenue estimates.
Consider two of the indictors we regularly follow.
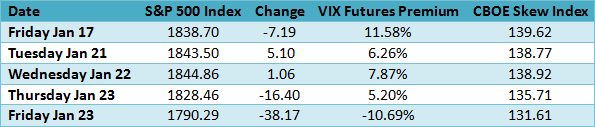
On Friday January 17, it appeared the SPX could continue higher since the VIX Futures premium was in the range we consider normal for an advancing market and the contrarian Skew was still fairly high suggesting out-of-money SPX puts remained active. However, on Tuesday as SPX advanced the VIX Futures premium declined into the cautious zone below 10% while Skew continued declining. Now the VIX Futures premium is negative 10.69% and referring to previous occasions we note negative readings are associated with market reversals but that does not necessarily mean right away. In addition, Skew could continue declining back toward the lower end of the current relevant range around 119 on put selling, as hedges are unwound.
Strategy Ideas
After last weeks’ decline, the S&P 500 Index is still above the current operative upward sloping trendline that begins at the November 16, 2012 low of 1343.35. It would have needed to close below 1744.12 to challenge this intermediate uptrend and to do that it will first need to close below support at 1775. However, considering the short-term trend is down, we have to hedge ideas below.
Hedging the Decline
Although the VIX Futures premium is already in negative territory it does not mean the decline is over however, it does suggest looking for possible places where it may attempt to retrace the decline, such as support at 1775. Since we do not know for sure how much downward momentum has been in unleashed, we should consider some hedges. The first one is the familiar VIX call option much like the suggestion made in?Digest Issue 1, “New Year Market Forecast.”
VIX Hedge Suggestion
CBOE Volatility Index??(VIX) 18.14.
Since VIX options are priced from the VIX Futures and the near term Future is most responsive to an increasing VIX, we suggest the February at-the-money call. First the options details.
The current?Historical Volatility?is 115.67 and 76.42 using the?Parkinson’s range method, with an?Implied Volatility Index Mean?of 108.28, up substantially from 57.53 the week before. The 52-week high was 112.90 on October 8, 2013 while the low was 44.89 on December 24. The?put-call ratio?at .44 is bullish for the VIX but bearish for SPX, while the volume was a whopping 1,621,709 contracts traded compared to the 5-day average volume of 1,012,310 reflecting good options liquidity.
![]()
One disadvantage of using VIX options is their wide bid/ask spreads. For this suggestion, the February 16 call is 1.60 bid/1.70 ask, which means there is considerable slippage when opening and closing positions.
Since the correction has begun watch for a further spike to the 20-22 range or higher and then a quick reversal closing lower when the correction appears finished so this position requires close monitoring. Comparing the implied volatility at 91.02 to the range Historical Volatility of 76.42 implies this call is somewhat expensive anticipating a further advance.
iShares Russell 2000?(IWM) 113.45. For those who prefer a tamer hedge strategy here is another idea.
Comparing Friday’s decline we see IWM was down 2.55% while the SPX was 2.09% lower and the?PowerShares QQQ?(QQQ) was down 1.97% giving it a slight edge on to downside so far.
The current?Historical Volatility?is 14.78 and 11.16 using the?Parkinson’s range method, with an?Implied Volatility Index Mean?of 17.75, up 14.43 the week before. The 52-week high was 22.72 on October 9, 2013 while the low was 12.65 on March 14. Theput-call ratio?at 2.05 is bearish, but it is normally high since it is a hedging favorite. Friday’s volume was a massive 999,614 contracts traded compared to the 5-day average volume of 539,020, reflecting good options liquidity with reasonable bid/ask spreads.
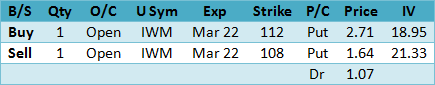
There is usually some implied volatility edge with put spreads, true with this spread as well having a good risk to reward ratio. There appears to be support at 107.50 from last September so the short put at 108 seems about right. Use a close back above 115 as the?SU?(stop/unwind).
Summary
While we were aware of the market risk as the S&P 500 Index struggled to overcome resistance at 1850 we assumed earnings reports to be most important recognizing disappointments could certainly turn the market lower leading to a long overdue correction. However, the correction began not from earnings disappoints, but due to negative macro developments in the emerging markets. For now, hedging long positions is the order of the day.