Volatility Kings? is our list of companies having a tendency to experience increasing option implied volatility as their quarterly reporting dates approach. Increasing implied volatility reflects uncertainty or the width of the possible stock price distribution on the report date. While these companies have experienced increasing implied volatility when they previously reported, the level of uncertainty for the current report may not be comparable. Indeed, some companies are on the list one quarter and not the next while others seem to remain on our list quarter after quarter. Since the focus is on earnings, others with high-implied volatility due to takeover speculation or FDA announcement events are not included along with those lacking sufficient liquidity due to low option volume.
Now for a quick market comment before getting started with our Volatility Kings? update.
S&P 500 Index?(SPX) For the bulls, the lackluster start in the New Year is not encouraging from at least one perspective. The January Effect also called the January Barometer proposes that when SPX closes higher in January, the probability increases it will also close higher for the year. The second part of this popular Wall Street maxim also says that when SPX closes higher the first week it will probably close higher for the month. Since the December 31 close was 1848.36 while Friday’s close, after the first full week of trading after the New Year holiday, was 1842.37, it declined 5.99 points for a disappointing first week, suggesting the probability has increased it will close lower for the month as well. We will have another look when we update the January Barometer in early February.
Now for first quarter Volatility Kings? update.
Volatility Kings 4Q Master?List
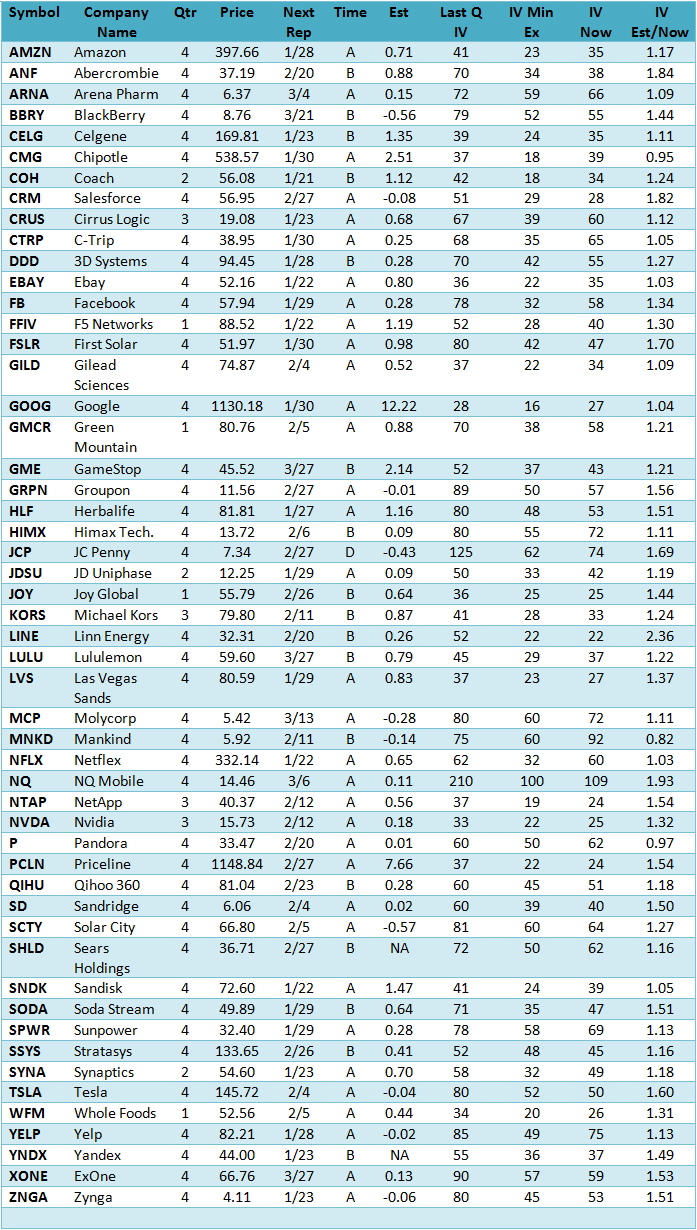
Price?shown in column 4 are closing prices as of Friday January 10, 2014.
Next Rep?in column 5 is the next expected reporting date. Check these dates as these are only estimates and the companies routinely change their reporting dates.?Time?in column 6 is when during the day to expect the report, where B is before the open, A is after close and D is during market hours.
Estimate?in column 7 is the current consensus earnings estimate that may also change before the report.
Last Q?IV?in column 8 is the implied volatility index mean (IVXM) of the puts and calls reached just before the last quarterly report, but may not necessarily be relevant this quarter, especially since market implied volatility as measured by the VIX is now lower at 12.14 than in some previous quarters.
IV Min Ex?in column?9?shows the implied volatility low after the last earnings report making it easier to compare the pre-report high to the subsequent low.
IV Now?in column 10 is the implied volatility index mean, (IVXM) as of Friday January 10, 2014.
IV Est/Now?in column 11 is the ratio of the estimated implied volatility to the current implied volatility based primarily on the high reached the previous quarter. Those with higher ratios have a potentially greater opportunity to increase going into their report date, but many have already started increasing in anticipation of their 4Q reports.
Comments and Observations?
The typical pattern is for implied volatility to decline for 4-6 weeks after reporting followed by a subsequent rise for about 3-4 weeks before the next report date, but they vary with each having its own unique pattern.
Not surprisingly those with be best ratios are the ones that will be reporting later since they may still be declining since last reporting, such as?BlackBerry?(BBRY),?Joy Global?(JOY) and?Lululemon?(LULU).
Those with ratios less than 1 for example,?Chipotle?(CMG),?Mankind?(MNKD) and?Pandora?(P) are currently experiencing high-implied volatility for reasons that are most likely unrelated to their upcoming earnings report.
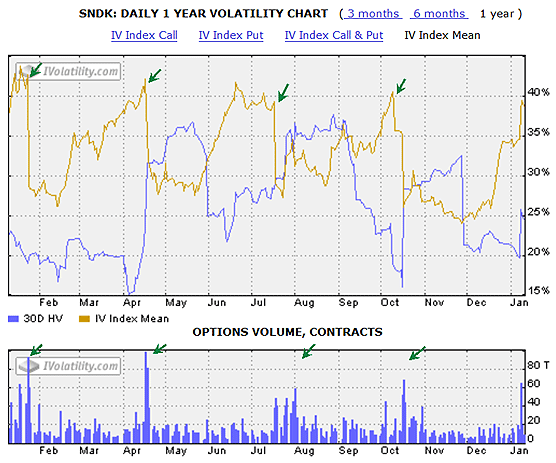
Some experience predictable declines after reporting such as?SanDisk?(SNDK) having gone from 41 to 24 although it is now back at 39 in anticipation of their 4Q report so the ratio of 1.05 does not tell the whole story. Since there are quite a few in this category, use the Master List as a reference and check each of their volatility charts using either our complimentary?Basic Options?or our very affordable subscription based?Advanced Historical Data?service.
For example, here is the updated SanDisk 4Q Basic Options volatility chart for the last year with green arrows indicating the decline in implied volatility at previous earnings reports. Note the regular pattern of advances into the earnings report date and the subsequent declines along with the spikes in option volume shown in the lower chart. Scheduled to report 4Q earnings on January 22 after the close, it is likely to advance somewhat higher and then decline on the report.
In an effort to keep the list size manageable we deleted those with 1 week average options volume less than 5,000 contracts since low volume means wider bid/ask spreads and more slippage that can represent a substantial part of any potential gain for a pure volatility trade. For example, this quarter we deleted?Akamai?(AKAM),?Mercardo Libre?(MELI),?Panera Bread?(PNRA),?Open Table?(OPEN) and?Under Armor?(UA).
Some Strategy Ideas
Long straddles and strangles are two alternatives to consider going into the reporting dates with plans to close them just before the report. However, the estimated implied volatility at the report date is a guideline based upon their most recent reports and may not be relevant in the current quarter. The actual reporting dates and earnings estimates need checking since they vary by the data source and are subject to change by the reporting companies and analysts.
For SanDisk it is too late for a long straddle or strangle since the implied volatility has almost reached it expected maximum for the quarter. So unless you are willing to sell a straddle or strangle requiring margin the best strategy is to wait about six weeks after the 4Q report, sometime in the first week of March and then open a long straddle or strangle anticipating their next 1Q report. Ideally, there should be 20 or more percentage points between the high and low to make these positions worthwhile. For SNDK we see the last high was 41 reaching 29 about six weeks later for 17% point decline, just under the ideal 20% minimum.
Not surprisingly with all its recent earnings problems,?JC Penny?(JCP) reached 125 before declining to 62 after its last report for a 63% differential. Now at 74 it appears to be rising again in anticipation of their 4Q report scheduled for February 27. This could be an interesting long straddle or strangle candidate.
Frequently calendar spreads are used for quarterly reporting by selling the near term option with higher implied volatility and buying the same strike price in the deferred month with a lower implied volatility. However, since this position will have short gamma or the rate of change of delta, any large move of the underlying on the report date will result in a loss.
Option prices continuously change in response to changing expectations. The higher the uncertainty the more valuable the option, implying there is a much wider distribution of possible outcomes. When they become more predictable, the implied volatilities no longer increase dramatically before the reporting dates and the option volume usually declines.
As for earnings reports, the range of earnings estimates or the difference between the high and low estimate for the upcoming earnings report reflects uncertainty. Those with high and rising IV going into the report usually have a tendency to show a greater divergence of opinion between the analysts, which seems very logical. Although there are shortcomings, implied volatility is a way to quantify stock price uncertainty.
For further analysis of the Volatility Kings? or other stocks in your portfolio, here is how to find our complimentary volatility charts, located on the?Basic Options?page of our website.
From our home page go to Analysis Services in the left column, and then find Basic Options listed seventh from the top. After opening the page enter the symbol where indicated (the default symbol SPX is already entered). Next, scroll down to the Volatility Chart heading located on the right side of the page near the bottom. Click on the small chart image and you will see a new enlarged data table along with the volatility chart for the last year displaying both the implied volatility and the historical volatility of the underlying symbol as well as the options volume. Previous earnings report dates are easy to find by the volume spikes accompanied by implied volatility declines like the ones shown for SanDisk above.
Summary
Although there are considerably fewer macroeconomic concerns at the first of this year compared to last, the equity market as measured by the S&P 500 Index is off to a weak start on low volume. At the end of the first full week of trading, the decline of 5.99 points suggests it may close the month lower as well according to the January Effect theory, which in turn says the probability has increased it will close the year lower.