In a rare almost textbook manner, the S&P 500 Index (SPX) came down and tested support at 1600, briefly trading as low as 1598.23 Thursday before promptly bouncing up to close at the high of the day at 1622.56, up 13.66. A reversal indeed confirmed by increased volume. Furthermore, it reversed right on the upward sloping trendline from the November 16 low of 1343.35 adding an important fourth point.
In this Digest, we consider what to do now right after reviewing our market indicators.
Review Notes
S&P 500 Index (SPX)
Two weeks ago, we were focused on the key reversal at the May 22 top and now just 11 trading days later it made a reversal up without the usual stuttering and stammering around the support area making the reversal seem to easy making us wonder if we should prepare for another retest.
E-mini S&P 500 Futures (ESM3)
Interestingly on Thursday as the SPX tested 1600 and rebounded the e-mini briefly traded at a premium to the cash as if it were throwing cash a lifeline. Since we know not to trust a reversal on low volume, we checked Thursday’s volume and open interest and confirmed both increased as required to confirm the reversal.
CBOE Volatility Index? (VIX)
The table below shows the VIX cash compared to the next two futures contracts as well as our calculation of Larry McMillan’s day-weighted average between the first and second months.
?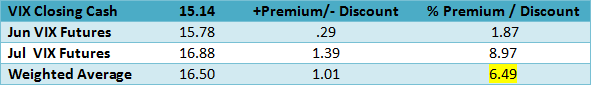
The day weighting applies 35% to June and 65% to July for an average premium of 8.95% shown above. Our alternative volume weighed average between June and July found in the Options Data Analysis section on our homepage is slightly lower at 7.68%. Both premium measures appear to be increasing again after being much lower during the week reflecting the flat term structure as the futures increased up toward the cash. For example, on Wednesday the volume weighted premium was -1.12 and averaged just .53 for the first four days of the week as SPX came down to test 1600. In the past flat term structures with low or negative premiums have signaled market turns.
When the futures term structure is in contango, or it slopes upward over time, the advantage goes to a long XIV position since it represents a short futures position as VXX continuously sells the near-term contract and buys the next longer term contract at a higher price. Friday the spread between June and July futures was -1.10, averaging -.89 for the week, while the July -August spread was -.78.
VIX Options
With a current 30-day Historical Volatility of 69.10 and 62.92 using Parkinson’s range method, the table below shows the Implied Volatility (IV) of the at-the-money VIX calls and puts using the futures prices based upon Friday’s closing option mid prices along with their respective month’s futures prices, since the options are priced from the tradable futures.
?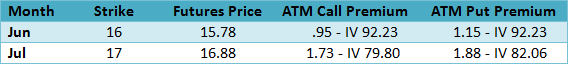
Using the IV Index Mean of 76.45 the IV/HV ratio is 1.11, using the range method for Historical Volatility the ratio is 1.22.
The VIX put-call ratio at .78 remains high and could be the result of additional put selling after a week when the at-the-money June 16 call closed at 1.25 Monday, 1.80 Wednesday, and finally .95 on Friday.
Friday’s VIX option total volume of 568,381 contracts compares to the 5-day average of 607,880.
The CBOE equity only put-call ratio at .67 was almost unchanged from the week before at .66 as the SPX put-call ratio declined to 1.55 from the week before when it was 1.80. The VIX put-call ratio of .78 compares to .75 the week before as the spread between the two ratios ended the week at -.11, about the same as the prior week at -.09.
During the 11 trading days of this correction from the key reversal down on May 22 to the reversal up last Thursday, none of our closely watched indicators, except for the low VIX Futures premium helped much to forecast the start, end or the extent of the correction assuming it is now completed.
CBOE S&P 500 Skew Index (SKEW)
SKEW measures the purchase of out-of-the-money S&P 500 Index puts that require a very large downside move to profit from long put positions. An increase of this index indicates greater expectations for an extreme down move. After advancing to 127.85 on Friday May 17 and then quickly declining all the way to 112.47 on May 28 only to close at 117.64 in the lower part of the range Thursday on the day SPX tested the 1600 support we have to admit this indicator is confusing since it should have reflected more uncertainty. We wonder if there could be some data accuracy issues involved.
US Dollar Index (DX)
There was no confusing the correlation of the dollar index with the equity market last week as it led or perhaps followed the equity decline only to find some support Friday on the equity rebound. Presuming the correlation remains positive we would expect to see the dollar advance as equities resume trending higher.
iShares Dow Jones Transportation Average Index (IYT)
On the correction, IYT closed below the important upward sloping trendline for three days, but abruptly rebounded Friday to close up 2.74, just back above the important trendline, good news for the followers of the Dow Theory and economically sensitive sectors.
NYSE McClellan Summation Index.
As expected during a correction the breadth indicator decline every day last week bringing it down 377.91 points and 602.35 since our last report. Now as the NYSE Composite Index turns higher we should expect to see it start to improve or it will create a negative divergence.