Strategy Idea
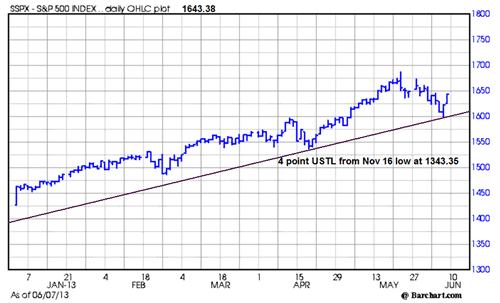
As we speculated two weeks ago, a decline to support at 1598.60 would be 5.25%, about right for correction in an upward going trend. In addition, it would then put it right on the upward sloping trendline (USTL see below), that begins from the November 16, 2012 low at 1343.35. Since it has been 202 days between the trendline low at point one on November 16 to Thursday’s low at 1593.23, we calculate the slope of the trendline to be 1.26 points per day.
?
As each test of the upward sloping trendline holds, it becomes harder for any future corrections to close below the supporting trendline. Based on this we expect to see a new high again soon.
On the reversal, we now need to turn our attention to the long side once again. Recalling what one of the more famous speculators said about selecting stocks after corrections, we paraphrase the late great Jesse Livermore, who said to pick stocks that have gone down the most since this is where the smart money will be looking to get back in. In addition, pick stocks that have gone down the least since this is where the smart money still is.
Trend Continuation
Accordingly, the top performing sector this year is solar energy and the top company in the sector is an old favorite.
First Solar, Inc. (FSLR)
We last suggested FSLR last year when it was 20.44. In early April it broke out to the upside after an analysts meeting and has not pulled back very much since including this most recent correction thus making it one of those that declined the lest on the correction and a long candidate once again. On the presumption the smart money still owns it, although the short interest is still relatively high at 35.80% as of May 15, consider this long call combination.
Here is the options data.
The current Historical Volatility is 59.07 and 57.17 using the Parkinson’s range method, with an Implied Volatility Index Mean of 64.31 up from 62.49 last week. The IV/HV ratio is 1.09 and 1.12 using the range method to calculate the HV. Friday’s put-call ratio was just bearish at .80, while the volume was 24,008 contracts traded compared to the 5-day average volume of 20,290.
Here is another long call spread short put combination. Although it requires some capital for the short put margin, it also adds some volatility edge and reduces the debit.
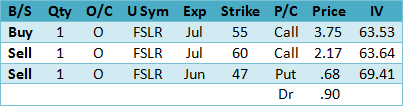
At 32% of the distance between the strike prices the call spread it has an attractive risk reward ratio. In addition, there is some edge in the short put, especially if implied volatility now declines somewhat along with the market. Use a close back below the most recent pivot at 50 as the SU (stop/unwind) or be prepared to take the stock by assignment should close below 47 at the June expiration in 12 days.
The suggestion above uses the Friday closing middle price between the bid and ask. Monday, the option prices will be somewhat different due to the time decay over the weekend and any price change.
?
Summary
From a technical perspective, after 11-days of correction from a key reversal down to the reversal up chances are the brief 5% decline is now in the history books and the uptrend is resuming. Look at heavily sold stocks & sectors and those that held up the best for new long candidates.