Since the month of May ends this week and since stocks have a long history of declining in May or June now is a good time for a progress report. So far, there is little evidence the major averages as represented by the large capitalization blue chip averages are the least bit concerned. However, the continuing disparity with the smaller capitalization stocks will eventually be resolved either by the big capitalization indexes declining, or by the laggards finding support and turning higher. Indeed, there was some evidence the smaller laggards found some support Friday.
After adding options to the perspective in our market review, we focus once again on the divergence between the S&P 500 Index and the iShares Russell 2000?and then add crude oil into the mix with a long suggestion for?United States Oil?(USO).
Market Review
S&P 500 Index?(SPX) ?with the new intraday and closing high made May 13 at 1897.45 thereby exceeding the April 4 high at 1897.28, negating the possibility of a Head & Shoulder Top. Then after a brief decline it came right back to challenge the high once gain by closing at a new all time high Friday, but just slightly under the intraday high of 1902.17 made on May 13, the new objective.
The larger capitalization stocks have been relatively stronger since March 4 when the?iShares Russell 2000?(IWM) ?peaked at 120.58 and then abruptly began selling off. Last week while looking for a potential right shoulder of a possible IWM Head & Shoulders Top that was not previously evident, the decline down to test 107.50 on Thursday May 15 had seemed to form either a possible double bottom or an attempt to advance back up to define a right shoulder. Either way, it looked oversold and due to rebound, so we suggested long call spread. Indeed, it continued higher closing at 111.97 Friday and notably above the well-defined three-point downward sloping trendline line from March 21 at 120.26. If Friday had not been the last trading day before a long weekend, it may have not exceeded the downward sloping trendline since small stock short covering was most likely the driving force that even helped push the S&P 500 Index higher to a record close.
CBOE Volatility Index??(VIX) ?created the other notable event last week closing 1.08 lower challenging the March 14 intraday low at 11.05 with the 11.30 close.
The table below shows the VIX cash compared to the next two futures contracts as well as our calculation of Larry McMillan’s day-weighted average between the first and second months.

The day weighting applies 85 to June and 15% to July for an average premium of 23.88% shown above. Our alternative volume-weighted average between June and July, regularly found in the Options Data Analysis section on our homepage, is slightly higher at 26.07%. We consider premiums less than 10% to be cautionary while the premiums for a normal term structure are 10% to 20%. Premiums above 20% are unsustainable suggesting a lack of enthusiasm for VIX hedging. From a contrary regression to the mean perspective, it suggests caution.
VIX Options
With a current 30-day?Historical Volatility?of 67.36 and 68.65 using?Parkinson’s range method, the table below shows the Implied Volatility (IV) of the at-the-money VIX calls and puts using the futures prices based upon Friday’s closing option mid prices along with their respective month’s futures prices, since the options are priced from the tradable futures.
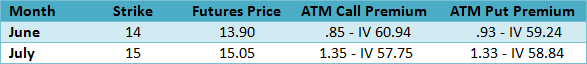
Comparing to the range historical volatility of 68.65 to the implied volatilities show both the June and July at-the-money options are underpriced. Friday’s volume was moderate at 582,815 contracts compared to the weekly average of 748,050 contracts. Like the VIX futures above, the options suggest little current enthusiasm for hedging just when it’s least expensive.
CBOE S&P 500 Skew Index?(SKEW) measures the purchase of out-of-the-money S&P 500 Index puts that require a very large downside move to profit from long put positions. An increase of this index indicates greater expectations for an extreme down move.
Lower by 2.10 for the week, SKEW, like the VIX futures and options above implies there is little additional interest in adding out-of-the-money S&P 500 Index puts for hedging. It remains 2.84 points below the midpoint of our arbitrarily defined relevant range between the rapid decline to 112.66 on March 14, followed by the spike higher to 143.27 on March 17. Until a close above 127.97, we consider SKEW to be confirming the sanguine views suggested by the VIX futures and options. It will deserve more attention when it closes back above 130.
While the VIX premium appears to be a coincident indicator, rapid advances in SKEW indicates significant increases in out-of-the money put buying normally near the top of an advance as a contrarian strategy by these seeking to hedge gains.
US Dollar Index?(DX) May 8 it tested the important chart level at 79 going back to last October and quickly made a key reversal. It now appears to be trending slightly higher in a range defined by the low at 79 and 80.50, a level twice tested since mid February.
iShares Barclays 7-10 Year Treasury ETF?(IEF) ?the gap opening breakout on May 14 followed by another advance May 15 took interest rates as low as 2.49% before consolidating in what appears to be a symmetrical triangle continuation pattern. If so, another upside breakout could take interest rates below 2.45% in a “risk off” flight to the safety of Treasuries perhaps due to macro concerns more than expectations for a slower US economy.
iShares Dow Jones Transportation Average Index?(IYT) ?no signs of expectations for a slower US economy here since the advance continues. In the meanwhile, overbought comments are being heard since it’s about 6% above the upward sloping trendline from the February 5 low at 125.50 and inconsistent with declining interest rates since the transports are one of the most economically sensitive groups. Keep an eye on IYT for any sign of weakness.