After a weak January, the time has come to update the January Barometer, also called the January Effect. According to the?Stock Trader’s Almanac?January’s S&P 500 Index close, up or down determines the likely direction of the for the year. Both the January 2014 close and the 2013 year-end result are included in the table below. Based on this record, there is a 54% probability of closing lower at year-end or as they say, there is a 54% probability that “as January goes so goes the rest of the year.”
Then we update our market indicators along with a strategy comment and some thoughts on additional hedging including another idea this one using?the?SPDR S&P 500?(SPY).
Here is the January Barometer data.
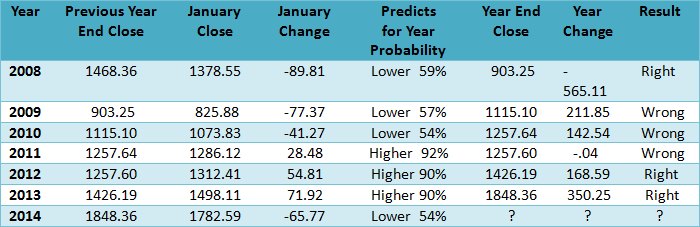
While this indicator produces mixed results for the years when January closes lower, the record for predicting higher closes for the years when January closes higher is 90% going back to 1950, based data from the Stock?Trader’ Almanac.?Since 2011 was almost flat, it was not included in the up year column when calculating the probability. This year the disappointing first week of the month set the stage for the final result, so based upon this indicator, the chances the market will end lower for the year are just a bit better than 50/50.
Strategy Idea
Last week we said hedging long positions was the order of the day. Now until the potential Head & Shoulders Top pattern is resolved we suggest reducing long positions while even considering some short ideas except for the oil and gas sector since crude oil remains relatively strong as indicated by the current backwardation in the futures market, which occurs when the near term futures are higher than the deferred months. Friday the March Futures closed at 97.53 while the June Futures were 94.85 making the term structure backward by 2.64. This could be a temporary condition related to weather. However, it is also the time of the year when crude oil normally starts advancing. In the meanwhile, the big event will be Friday’s employment report.
Hedging the Decline
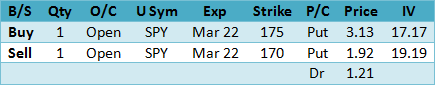
SPDR S&P 500?(SPY)?Along with the?iShares Russell 2000?(IWM) ?hedge suggestion from last week, here is another, but this time it’s conditional.
Since we are expecting the S&P 500 Index will attempt to rebound to form the right shoulder of the Head & Shoulders Top described above, we suggest delaying this trade until SPY reaches 181. However, if it immediately declines through the current indicated Neckline then go ahead since the right shoulder attempt will come from a lower level.
The current?Historical Volatility?is 12.16 and 8.70 using the?Parkinson’s range method, with an?Implied Volatility Index Mean?of 15.54, up from 15.02 the week before. The 52-week high was 18.85 on October 8, 2013 while the low was 9.35 on March 4. Theput-call ratio?at 1.40 is bearish, but it is normally high since it is a hedging favorite. Friday’s volume was a massive 3,315,089 contracts traded compared to the 5-day average volume of 2,671,650, so it has good options liquidity with reasonable bid/ask spreads.
With a slight implied volatility edge use a close back above 180 as the?SU?(stop/unwind), presuming it has been implemented.
The suggestion above uses the closing middle price between the Friday bid and ask. Monday, the option prices will be somewhat different due to the time decay over the weekend and any price change.
Summary
Unlike last year, this year’s January Effect suggests the probability slightly favors a lower close at yearend. In the meanwhile, there is a potential Head & Shoulders Top developing that could become the long awaited correction. For now, we suggest unwinding long positions while adding hedges to those that remain open.