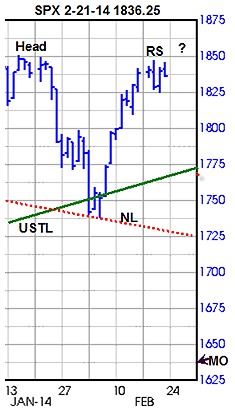
While we continue pounding on about a potential Head & Shoulder Top pattern, some are likely to be thinking it?s time to “give up on it already!” It would be stubbornly foolish not to acknowledge the probability diminished greatly last week. However, since there has not been a close above the potential Head perhaps all that happened last week was the possible formation of the missing right shoulder on Wednesday??We have a snap shot of the updated chart below.
Market Review
S&P 500 Index?(SPX) Last week it seemed as if there would be a close above the potential Head at the January 15 high of at 1850.84. However, it stalled Wednesday at 1847.50 making a small Key Reversal as both the VIX put call ratio at .21 and the VIX Futures premium at -7.30% produced bearish signals suggesting increased hedging activity as the cash SPX closed off 12.01. Adding to the concern was the increasing?CBOE S&P 500 Skew Index?(SKEW) ?with a net advance of 9.54 for the week and 8.39 points above the mid-point of the current relevant range. Thus it appears professional hedgers are preparing for a decline.
The numbers corresponding to the labels are,?HEAD?at the January 15 high at 1850.84.?RS?could be the missing right shoulder high made last Wednesday at 1847.50.
The current operative upward sloping trendline?USTL,?in green runs from November 16, 2012 low of 1343.35, now crossing at 1770.16.
NL, the downward sloping dotted line, is the Neckline running between the December 18 low of 1768.36 and 1737.92 made on February 5.
The?MO?in the lower right corner at 1637.50 marks the estimated downside Measuring Objective, obtained by measuring the average distance between the top and the downward sloping neckline and then subtracting it from the neckline.
It’s uncertain if Wednesday’s high of 1847.50 will prove to be the missing right shoulder or if it finally breaks out to close above the old high as indicted by the???However, we do see evidence of increased professional hedging activity. On a possible decline, another interpretation could be a double top – both suggest much lower levels from here.
Again Hedging a Possible Decline
CBOE Volatility Index??(VIX)?For those wondering why we are spending so much time and effort on the potential Head & Shoulder Top and hedging strategies consider,
“Bull markets take the stairs, but bear markets take the elevator.”
Sam Stovall S&P Capital IQ chief equity strategist
While our Head & Shoulders Top measuring objective down at 1637.50 would not technically qualify as a bear market, it would still most likely be a rapid decline in the event of activation on a close below the neckline, now about 1730. However, like professional hedgers we will not wait for a decline below the neckline to implement our position.
Here are the details for the VIX options.
The current?Historical Volatility?is 137.40 and 84.11 using the?Parkinson’s range method, with an?Implied Volatility Index Mean?of 67.30, up from 61.03 the week before. The 52-week high was 117.20 on February 3, 2014 while the low was 44.89 on December 24, 2013. The?put-call ratio?at .33 is near the lower end of its recent range in bearish territory. The implied volatility ratio of .80 compared to the range historical volatility at 84.11, means the options are not expensive. Friday’s volume was 471,757 contracts traded compared to the 5-day average volume of 791,260.
If we were to implement a call spread as a hedge today here are the numbers using Friday’s data.
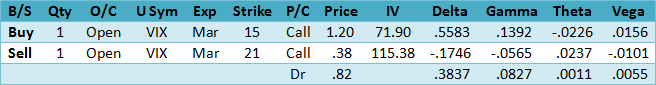
The March VIX options are not priced from the VIX at 14.38, but from the March VIX Futures contract that closed at 15.15 on Friday. Comparing the implied volatility of the long call at 71.90 to the range historical volatility of 84.11, we see there is a slight edge. However, notice the implied volatility of the short call at 115.38. In addition, notice how Theta, time value decay of .0011 is positive.
We selected March 21 for the short call since it is the most recent high reached on February 13 making a good target. We also see a low down at 11.69 made on December 26, 2913 so we will use that as the low-end mark to determine a range with a midpoint of 16.59 that we will use as our trigger for a conditional hedge strategy.
Since we do not know for certain the right shoulder has been formed our trade plan will be conditional using VIX as our indicator. Therefore, on a close above 16.59 we will implement the hedge using a long March 16 call or alternatively the then at-the-money call and a short March 21 call. Be prepared to the pay the full to bid/ask spreads on entry and exit, as they seem inflexible.
The suggestion above uses the closing middle price between the Friday bid and ask. Monday option prices will be somewhat different due to the time decay over the long weekend and any price change.
Summary
Although looking less likely, we cannot rule out the possibility that a Head & Shoulders Top will form until the S&P 500 Index closes above 1850.84. However, we do see evidence of increased hedging activity by professionals using VIX Futures and Options as well as S&P 500 Index options making us cautious so preparing for a decline that may soon get underway seems sensible.