In the Extended Learning Track course last week, we were discussing how to identify the trend of the security we are planning to trade. While there is no substitute for reading price itself, you can use some technical tools to assist you in your trading decisions. Some time ago, I wrote about one method to ?fine tune? a moving average to better identify the trend. I thought it would be appropriate to revisit that topic.
Moving averages are a part of many traders? analysis tools. A question I usually receive from students is, ?What period moving average is best to use?? While there is no one moving average that is perfect and will work all the time, there is a way to identify the best average for the security and time frame that we are trading.
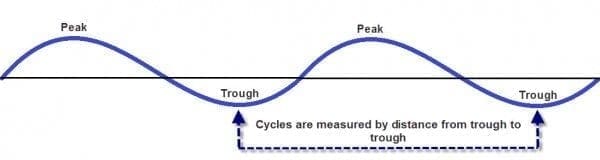
All securities have cycles that affect the price movement. If we can identify the cycle that is dominating our stock, we can identify with a higher probability when tops and bottoms in price will occur and when we should buy or sell our stock. Cycles are measured from trough to trough. The troughs are the low points in price that correspond with the lows in the cycle. While this sounds complicated, there is a tool built into TradeStation that assists us in finding the right cycle for our security and the time frame.
Looking at the daily chart of the SPY (the ETF for the S&P 500), we can see that the stock seems to make bottoms at a fairly regular interval.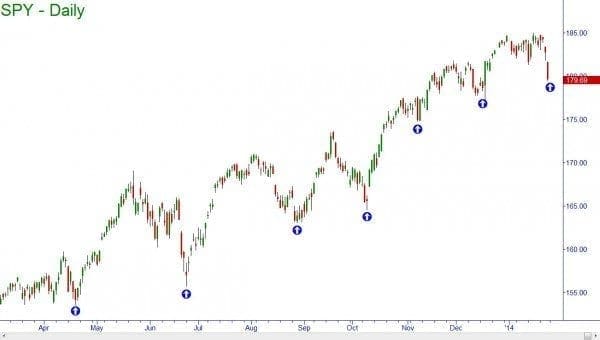
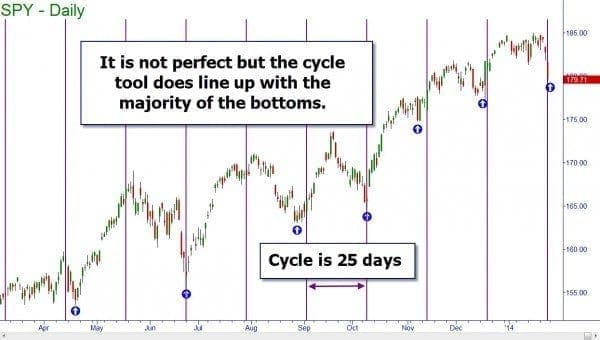
We can then select the time cycle tool on our platform and start from a major low.? The tool will default to arches but I prefer lines as seen on my chart.? To switch to the lines, you simply right click on the cycle arc and deselect arc on the pop-up menu.? You can also change the color from that menu as well.? You will then need to click on one of the lines and drag it to another bottom in price.? Look to see that the resulting lines match up with most of the bottoms.? You will not always have every bottom matched but a majority is what you want.
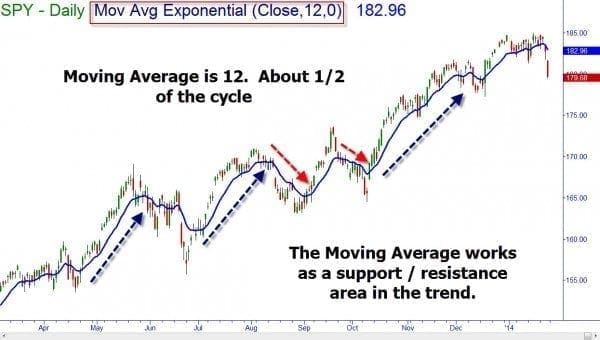
When we are using moving averages, we acknowledge that it is an average of price and that price will move away from that average and revert back during a trend. The average should be much like the black line dissecting the cycle I drew in figure 1 of this article. We want an average that is half the length of the cycle so that it will show our peaks and troughs as movements from and to the average itself.
In an uptrend, we should see prices move away from the average only to snap back to them when the trough of the cycle occurs. If we are changing to a downtrend, then the average would be violated and the price would bounce off of it to the downside before returning during peaks in the cycle. If the average is being violated in both directions, then we do not have a strong trend in that time frame.
By using the right average for the time frame you are trading, you can increase your odds for success. Just be careful to check the cycle from time to time as cycles can change with market conditions. We need to adapt with the markets for maximum success. Until next time, trade safe and trade well!
Brandon Wendell