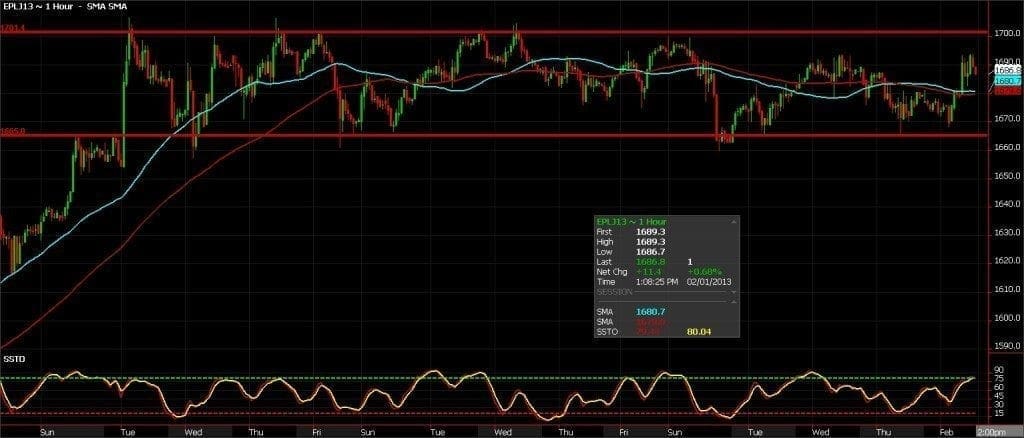
I am going to do something a little different today as opposed to a daily or weekly chart, above you will see a 60 minute chart of platinum. In this chart you can see activity over the last 3 weeks and you will notice that platinum is a sale around $1700 and a buy around $1660. I prefer to be a seller so I have opted to sell with clients and cover on the lower end of the range as opposed to reverse. To shed a brighter light look at the daily chart and you will notice that prices rallied 12% from the first of the year but have consolidated since. My stance is that in the coming weeks we could get a bigger break putting prices well below $1660 but until that happens play the range.
A futures contract is 50 ounces which means that every $1 move you?re making or losing $50 per futures contract. Also seen on the daily chart if prices were to trade back to their 50 and 100 day MAs this would put April futures $60-70 lower. Coincidence or not this would also amount in a 50% retracement so I think a reasonable target as enough technicals are pointing to that level. Be willing let go of the trade on a settlement above $1705.