There are so many factors to consider when creating trade strategies, and for most of us the task is daunting. Supply and demand are the most powerful forces, but sometimes panic and seemingly irrational rallies and declines occur. Technical analysis or pattern recognition is what most traders use while waiting for fundamental data, such as earnings reports, inflation reports or inventories, and sentiment. We do not have the luxury of research departments or economists to help us with decisions. But we do have patterns in price action that repeat and can help forecast trends or the end of them.
Every technical tool or indicator works at some point, but none of them works all the time. In this post we will cover the most common breakout patterns or technical setups for catching trends.
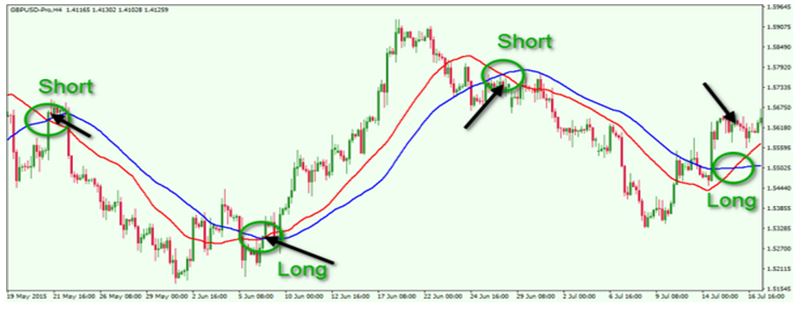
Moving Average Cross
The signal involves two numbers, a slow and fast moving average (MA) of closes in this example. In the chart below, there is a sell signal when the fast or shorter time frame MA (red) crosses below the slower MA (blue). And a buy signal occurs when red gets above blue. This is the most basic technical signal.
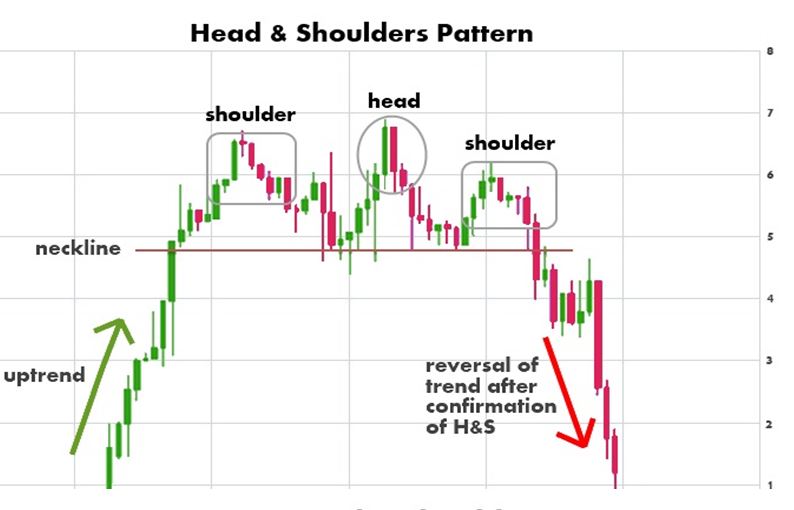
One of the most popular setups is called a Head & Shoulders pattern. This pattern is common at the end of a trend and takes shape following large vertical moves, either up or down. The charts below illustrate the onset of a breakout up and down. Markets tend to find balance after a trend, and choppy trade is common while this setup develops. Plus, volume tends to diminish just before the breakout occurs. A neckline forms and volume increases when the breakout ensues.

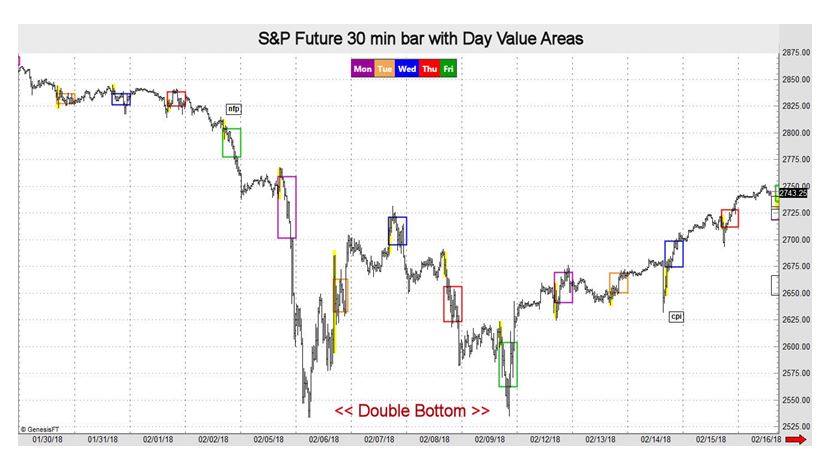
Another indication that a trend is about to occur is when a low or high is retested and rejected. This pattern recently developed after stocks declined at a historic pace. The chart below shows what happened, and the ensuing rally is still intact.