Volatility Kings? is our list of companies having a tendency to experience increasing option implied volatility as their quarterly reporting dates approach. Increasing implied volatility reflects uncertainty or the width of the possible stock price distribution on the report date. However, the degree of uncertainty for the current report may not be comparable. Indeed, some companies are on the list one quarter and not the next while others seem to remain on our list quarter after quarter. Since the focus is on earnings, others with high-implied volatility due to takeover speculation or FDA announcement events are excluded along with the others lacking sufficient liquidity due to low option volume.
Using last quarter’s list those with average daily options volume less than 5000 contracts last week were deleted along with those declining less than ten percentage points from their pre announcement high last quarter. Eliminated this quarter were CTRP, GME, HIMX, JOY, SHLD, SODA, SYNA, UBNT, VMW, VRX, and WDAY.
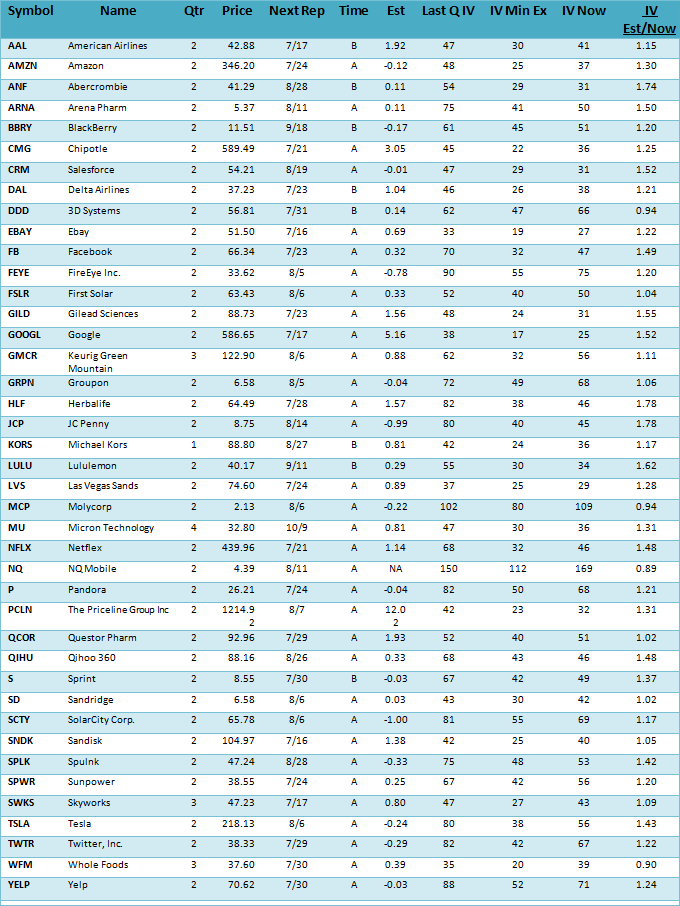
New additions: AAL, DAL, FEYE, MU, PCLN, S, SCTY, TWTR
Price?shown in column 4 are closing prices as of Friday July 11, 2014.
Next Rpt?in column 5 is the next expected reporting date. Check them as these are only estimates and the companies routinely change their reporting dates.?Time?in column 6 is when during the day to expect the report, where B is before the open, A is after close and D is during market hours.
Estimate?in column 7 is the current consensus earnings estimate per share, also subject to change before the report date.
Last Q?IV?in column 8 is the implied volatility index mean (IVXM) of the puts and calls reached just before the last quarterly report, but may not necessarily be relevant this quarter. Further the near term at-the-money implied volatility could be considerably higher than the index mean.
IV Min Ex?in column?9?shows the implied volatility low after the last earnings report making it easier to compare the pre-report high to the subsequent low. For some, the implied volatility is still declining so there may still be a lower low. Examples are BBRY and MU.
Events unrelated to earnings reports can also affect implied volatility, such as the recent rotation out of cloud, mobile, social and biotech stocks unrelated to earnings.
IV Now?in column 10 is the implied volatility index mean, (IVXM) as of July 11, 2014.
IV Est/Now?in column 11 is the ratio of the estimated implied volatility to the current implied volatility based primarily on the high reached the previous quarter. Those with higher ratios have a potentially greater opportunity to increase going into their next report date and many have already started increasing anticipating the next report.
To identify the highs and lows along with other details, make sure to check the volatility charts at either the?Basic Options?or?Advanced Historical Data?pages on our website.
Comments and Observations?
The typical pattern is for implied volatility to decline for 4-6 weeks after reporting followed by a subsequent rise for about 3-4 weeks before the next report date, but they vary with each having its own unique pattern.
Not surprisingly those with be best ratios are the ones that will be reporting later since they may still be declining since last reporting, such as?BlackBerry?(BBRY),?Micron Technology?(MU).
Those with ratios less than 1 for example, are currently experiencing high-implied volatility for reasons that may be unrelated to their upcoming earnings report.
Some Strategy Ideas
Long straddles and strangles are two alternatives to consider going into the reporting dates with plans to close them just before the report. However, the estimated implied volatility at the report date is a guideline based upon their most recent reports and may not be relevant in the current quarter. The actual reporting dates and earnings estimates need checking since they vary by the data source and are subject to change by the reporting companies and analysts.
Frequently calendar spreads are used for quarterly reporting by selling the near term option with higher implied volatility and buying the same strike price in the deferred month with a lower implied volatility. However, since this position will have short gamma or the rate of change of delta, any large move of the underlying on the report date will result in a loss.
Another strategy to consider is call credit spreads since they are advantageous when implied volatility is high going into an earnings report especially when the stock has risen in anticipation and is up against resistance.
Option prices continuously change in response to changing expectations. The higher the uncertainty the more valuable the option, implying there is a much wider distribution of possible outcomes. When they become more predictable, the implied volatilities no longer increase dramatically before the reporting dates and the option volume usually declines.
As for earnings reports, the range of earnings estimates or the difference between the high and low estimate for the upcoming earnings report reflects uncertainty. Those with high and rising IV going into the report usually have a tendency to show a greater divergence of opinion between the analysts, which seems very logical. Although there are shortcomings, implied volatility is a way to quantify stock price uncertainty.
Individual investors relying upon the earnings forecasts and playing the expectations game wondering if they may be too high or too low are disadvantaged when anticipating the direction the stock will move after reporting. However, if the implied volatility has risen enough into the report date it may offer an opportunity for a volatility strategy and not rely upon getting the direction right. In addition, since earnings reports reoccur every quarter there may be more than one opportunity, especially for the ones that have a regular pattern of rising into the report date.
For further analysis of the Volatility Kings? or other stocks in your portfolio, here is how to find our complimentary volatility charts, located on the?Basic Options?page of our website.
From our home page go to Analysis Services in the left column, and then find Basic Options listed seventh from the top. After opening the page enter the symbol where indicated (the default symbol SPX is already entered). Next, scroll down to the Volatility Chart heading located on the right side of the page near the bottom. Click on the small chart image and you will see a new enlarged data table along with the volatility chart for the last year displaying both the implied volatility and the historical volatility of the underlying symbol as well as the options volume. Previous earnings report dates are easy to find by the volume spikes accompanied by implied volatility declines.
Since the Volatility Kings? list constantly changes we can use your help identifying new candidates. If you have any suggestions please let us know. Send them to?Support@IVolatility.com
Summary
As the pace of earnings report releases increase this week, focus will be on the S&P 500 Index along with the iShares Transportation Average with particular attention on the relatively weaker iShares Russell 2000. The recent weakness in commodities especially crude oil and corn raises questions about an economic slowdown that conflicts with the relative strong transportation average.