Returning to Sell in May, there is little doubt that selling in small capitalization stocks continued while the large stocks advanced. However, when comparing to last year it is still too soon for the bulls to declare all is well. Last year on May 22, 2013, the S&P 500 Index made a key reversal setting up a 7.5% decline that lasted until June 24. At the same time, the iShares Russell 2000 also made a key reversal from a new high of 100.38 and then declined 6.5% ending on June 24. This is in sharp contrast to this year since the small capitalization index is nowhere near a new high having just tested a potential neckline that would set off a Head & Shoulders Top that would suggest much lower prices in the event of activation. This seems to indicate much less tolerance for equity risk than this time last year.
In fact comparing IWM to SPY, we see relative risk trended higher until March 4 when it broke below the upward sloping trendline beginning November 15, 2012.
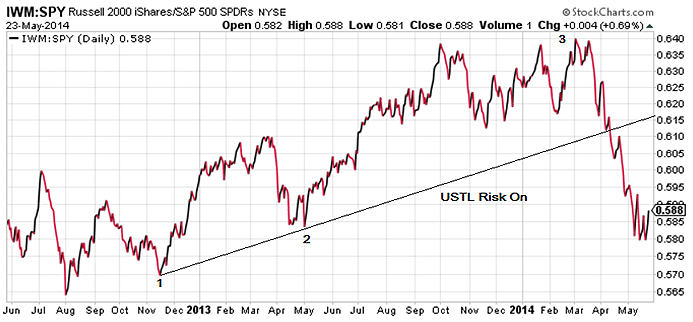
Here are the points used to construct the chart above where USTL is the upward sloping trendline as a proxy for relative equity risk.
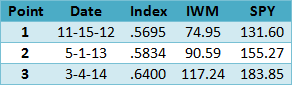
While both indexes could decline, in the lower right, we see the index currently at .5880 is still above the November 15, 2012 low of .5695 suggesting a further relative decline is still possible.
Eventually the divergence with the NASDAQ and small capitalization stocks represented by the iShares Russell 2000?along with “growth and any price stocks” will be resolved either by the big capitalization indexes declining, or by the laggards finding support and turning higher. As mentioned above the low VIX along with the steep futures curve and low options prices implies a decline in the large capitalization issues could begin to resolve the divergence.
Referring to the ongoing rotation issue, we see energy as defined by crude oil and the related energy sectors have been increasing.
When comparing last year’s S&P 500 Index decline to crude oil using United States Oil (USO) we notice SPX declined 5.35% between May 22 and June 24 while USO advanced .54%. This suggests seasonal strength in crude oil and we are seeing similar strength again this year. Accordingly, a long crude oil positions would appear to have relatively less risk.
Seasonal Crude Oil
United States Oil?(USO) 38.18. July crude oil closed at 104.36 and has been in backwardation, when the near term futures contracts are priced higher than the deferreds, for 20 weeks. This is important for USO since when the term structure is in normal contango there is a loss as the contracts are rolled out to the next month. However, when in backwardation this ETF underperformance risk is reduced or eliminated.
Next checking the options implied volatility shows they are near the 52 week low and would normally be expected to rise if the underlying declines in price. However, since we are not expecting to see a price decline there is no reason to expect the implied volatility to increase signficantly unlike the major stock indexes described above. If increasing implied volatility was expected then a strategy using more long options would offer an advantage. In this situation it does not seem necessary.
The current?Historical Volatility?is 10.43 and 8.00 using the?Parkinson’s range method, with an?Implied Volatility Index Mean?of 14.58, up slightly from 14.21 the week before. The 52-week high was 28.16 on August 28, 2013 while the low was 13.66 on December 26, 2013. The implied volatility/historical volatility ratio using the range method is 1.82 so the option prices are expensive relative to movement of the ETF but below the midpoint of the 52 week range. The?put-call ratio?at .80 is normally just bearish, but relatively low since it makes a good hedge against crude oil prices. Friday’s volume was 29,333 contracts traded compared to the 5-day average volume of 34,730 contracts, so options liquidity in the normal expiration months is reasonable.
Here is a long call spread to consider.
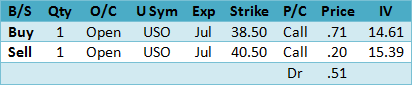
With a good risk to reward ratio use a close back below the April breakout support at 37.81 as the?SU?(stop/unwind).
The suggestion above uses the closing middle prices between the Friday bid and ask. Tuesday option prices will be somewhat different due to the time decay over the weekend and any price change.
Summary
May is not quite over and rotation out of “growth at any price stocks” along with weakness in small capitalization stocks continues to cause concern about the successful exit from high price to earnings ratio stocks without causing an overall market decline. Although the S&P 500 Index reached a new closing high, the smaller capitalization issues may continue struggling and since the VIX along with VIX futures and option are now at extreme levels long inexpensive put options used for hedging remains a prudent course of action. In the meanwhile, crude oil appears to be seasonally strong.