Recently, I Tweeted that the equity markets may be ending their daily bullish trend.? A bullish trend is a series of higher highs and higher lows.? The S&P 500 index recently broke that and made both lower highs and lower lows.
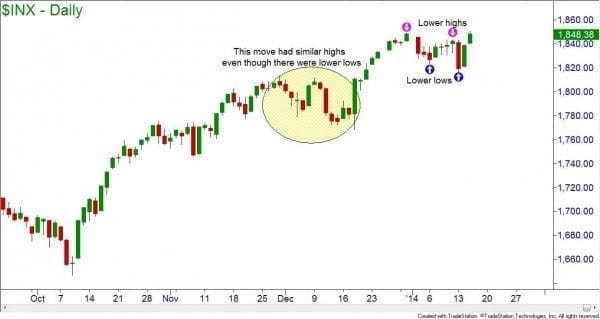
Do not start to panic and sell all of your longs and go short yet.? The bearish trend has failed to materialize as we made a higher high before the week ended.? In fact, we still have a bullish trend on the weekly charts.? This recent price pattern is the first time we have seen the lower highs in the daily chart since the August 2013 decline of nearly 5%.? We may be overextended but I am not looking at a recession yet.
That being said, we do have warning signs from related markets.? In an older article, ?Going Down?? from April 2008, I noted that the peak of the bond market usually precedes the start of a recession by about 27 months.? We peaked in July 2012 and are therefore on track for a recession near November 2014.
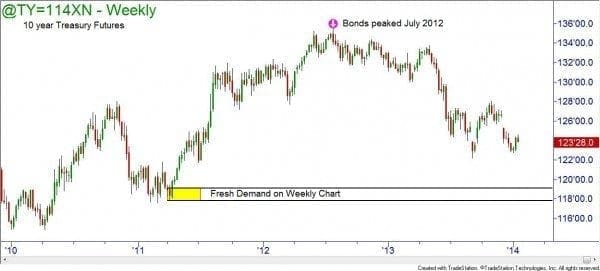
The stock market usually peaks nine months prior to the start of the recession.? If the bond prediction holds, then we should expect a peak in the month of February for equities.? This cycle held true in the last recession as bonds peaked in June 2006 with stocks peaking in October 2007.? The recession was officially announced in November 2008 but began well before.
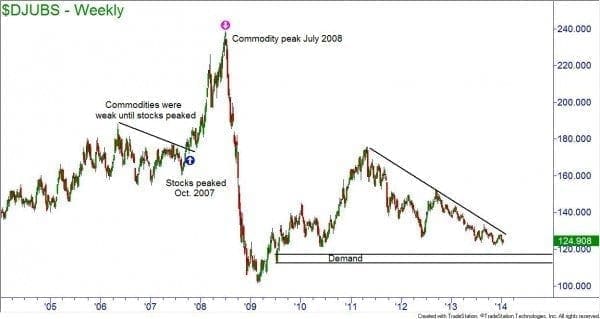
The last market to peak is the commodity market.? This peak usually occurs two to three months before the recession begins.? They remained weak until stocks started to fall in October 2007.? Then they erupted as investors looked for safety.? There is a similar pattern now as we get closer to long term demand.
So there are warning signs for equity market weakness.? As I said, no need to panic yet, just be aware of the environment and prepare yourself for what may lie ahead.? To learn more, join us in one of our courses at Online Trading Academy.
Brandon Wendell