After declining down to the operative and seemingly impenetrable upward sloping trendline before promptly reversing to the upside just before the release of weaker than expected January employment numbers on Friday, there is a case to be made that the equity pullback is over. It may be premature to conclude, but if so, this shallow pullback would resemble several others made last year, while the index trended higher. However, there is still the matter of the potential Head & Shoulders Top to consider as detailed below.
Market Review
S&P 500 Index?(SPX) From a classical bar chart perspective, the Hydra Head & Shoulders Top described last week in?”January Barometer 2014″ could still be alive even though the index found solid support and rebounded off the upward sloping trendline. If so the advance will stall somewhere between 1798.77 and resistance at 1818.52 to form the missing right shoulder. Although this interpretation is not the commonly accepted view, we are not yet willing to dismiss it entirely. Here is the updated chart.
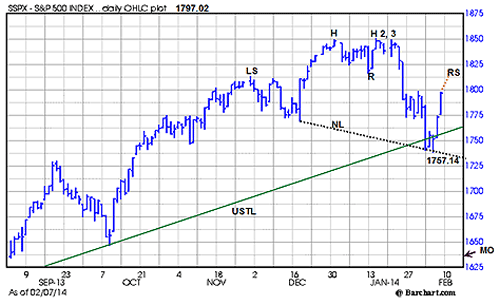
The numbers corresponding to the labels above are,?LS?is the potential Left Shoulder high at 1813.55 made November 29.?H?is the first possible Head made at the December 31 high of 1849.44.?H2?is the January 15 high at 1850.84, followed by?H3,?the high of 1849.31 made January 21.
The current operative upward sloping trendline?USTL,?in green above runs from November 16, 2012 low of 1343.35, and now crosses at 1757.14 marked above. Note support at the upward sloping trendline was tested and slightly breached but seems to have held last week’s decline.
NL, the downward sloping dotted line, is the new Neckline running between the December 18 low of 1768.36 and last Wednesday’s low at 1737.20.?R?is the upside resistance and a likely target for any possible rebound. The orange dotted line represents the expected upward path that would form the missing?RS, Right Shoulder.
The new?MO?at 1637.50 marks the estimated downside Measuring Objective, obtained by measuring the average distance between the top and the downward sloping neckline and then subtracting it from the neckline.
If this pattern is to develop then right shoulder will need to develop before the index exceeds the previous high on at closing basis at 1850.84 and the most likely place is around resistance at 1818.52. Any decline in this area would be reason to consider some long puts or put spreads.
CBOE Volatility Index??(VIX) The 3.12-point decline from last week and especially from the spike up to 21.48 last Monday is bullish.
The table below shows the VIX cash compared to the next two futures contracts as well as our calculation of Larry McMillan’s day-weighted average between the first and second months.
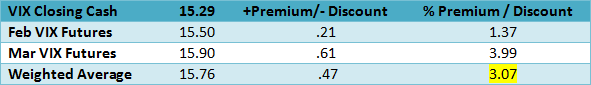
The day weighting applies 35% to February and 65% to March for an average premium of 3.07% shown above. Our alternative volume-weighted average between February and March, regularly found in the Options Data Analysis section on our homepage, is slightly lower at 2.51%. Both are once again positive as the term structure reverted to a normal positive premium after having been negative last week, another bullish reading.
VIX Options
The implied volatility of the VIX options declined from 102.50 to 74.59 adding more weight to the bullish interpretation supporting the view that the pullback is now complete.