GM Options Trade Smacks of Rebound Hopes
One large options combination implies better times ahead for shares of GM after January sales data spurred selling in the group and amongst the automakers group in general. Shares in GM fell to the weakest since October following news that much weaker deliveries of Chevy Silverados and Malibus contributed to a system-wide slide of 12%. Typically, Ford and GM count their customers in those regions worst affected by winter storms and unusually frigid temperatures. Automakers consider 60-days as an ideal inventory reading. That GM?s measure of inventories rose to 111 days not only captures the impact on sales but also helps explain in part weakness in Monday?s manufacturing data as factories slow dramatically in response to weak customer demand.
Chart ? GM option bull ? March 37/42 1*2 ratio call spread @68 cents.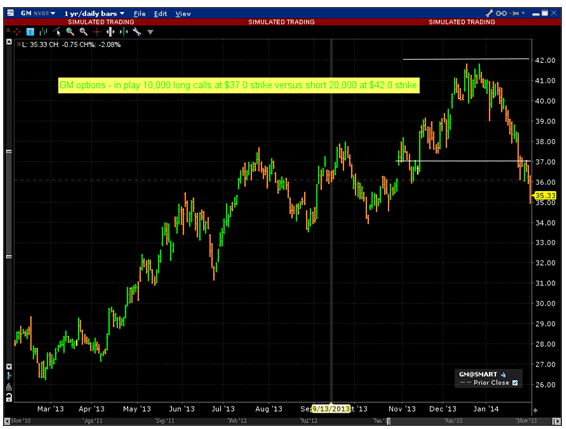
While shares in GM are currently lower by 2.6% to $35.15 one options trade suggests a speculator is looking for a sales rebound to occur quickly and one that would drag its share price sharply higher. Time and sales data shows the purchase of 37.0 strike calls expiring in March around 10,000 times at 94-cents per contract, while at the higher 42.0 strike sales of around two-times that volume was evident at 13-cents per contract. The product is a one-by-two ratio bull call spread to produce a lower breakeven price for the bullish trader. A simple one-to-one ratio would have produced a breakeven share price of $37.81, while in this leveraged version the trade breaks even above $37.68 implying a jump from its recent trading price by 7.6%. And so three up-days of the same magnitude as Monday?s down-day would make this trader feel a lot better. Shares last traded above that price as recently as January 24, while they peaked as high as $41.85 on December 26. The trade would continue to make profits as long as shares in GM remain below $46.32 at expiration.
——————————————————————————————–
Note: The material presented in this commentary is provided for informational purposes only and is based upon information that is considered to be reliable. However, neither Interactive Brokers LLC nor its affiliates warrant its completeness, accuracy or adequacy and it should not be relied upon as such. Neither IB nor its affiliates are responsible for any errors or omissions or for results obtained from the use of this information. Past performance is not necessarily indicative of future results.
This material is not intended as an offer or solicitation for the purchase or sale of any security or other financial instrument. Securities or other financial instruments mentioned in this material are not suitable for all investors. Any opinions expressed herein are given in good faith, are subject to change without notice, and are only correct as of the stated date of their issue. The information contained herein does not constitute advice on the tax consequences of making any particular investment decision. This material does not take into account your particular investment objectives, financial situations or needs and is not intended as a recommendation to you of any particular securities, financial instruments or strategies. Before investing, you should consider whether it is suitable for your particular circumstances and, as necessary, seek professional advice.
?