Expanding on comments from last week’s issue,?”New Year Market Forecast”, each year we start a new file for economic and market forecasts that begin in December and usually reach a crescendo in late January. At the end of the year when we compare these early forecasts to the actual results, we normally see some were fairly close while others were wide of the mark as should be expected. However, last year was an exception as most of the early forecasts were not even close. From the S&P 500 Index trading below 1300 to WTI Crude Oil at $70 per barrel, corn at $8.00 a bushel and gold at $1,900 an ounce they were way off the mark. It seems like they must have been forecasting an entirely different year. Early predictions of slow GDP growth were closer but those for the equity market advance in the 8%-10% range did not come close to the actual 29.6% gain for the S&P 500 Index.?
Market Review
S&P 500 Index?(SPX) On a closing basis, SPX has yet to exceed the December 31 high at 1849.44 as resistance at 1850 has been hard to overcome. While it traded as high as 1850.84 last Wednesday, it failed to close higher than 1849.44. Looking back at the period between October 30 and November 13 we see an almost identical pattern as it tested and finally overcame resistance at 1775. It will do the same again but it may take awhile longer since 1850 is not only resistance but also the lower end of the current Elliott 5th Wave objective between 1850 and 2033.
E-mini S&P 500 Futures?(ESH4) One way to measure trend momentum is to watch open interest since it needs to keep expanding to sustain the move. On September 20, after the September expiration, open interest was 2.57 million contracts. By December 11, just before the rollover volume surge, it had steadily increased to 2.97 million contracts. On December 20, after the December expiration, open interest was 2.73 million contracts and as of Thursday January 16, it had increased to 2.90 million with no evidence of decline along the way thereby supporting the bullish case. For a gauge as to when the trend may be changing watch for a sustained decline in the open interest indicating existing long liquidation to existing shorts who begin covering. Although there will be some confusion around expirations due to contract rollover surge, a sustained decline in open interest could be the first indicator that the uptrend momentum is waning.
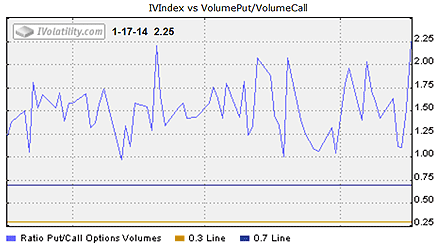
Comparing the SPX?put-call ratio?to last week shows a substantial increase from 1.40 to 2.25 as call volume declined and put volume increased to reach the highest in three months. See the chart from Advanced Options below, that suggests increased hedging activity.
CBOE Volatility Index??(VIX) . After starting the week modestly higher it closed just .30 higher and not too far above the December 26 low at 11.69 reflecting little concern for a market decline.
The table below shows the VIX cash compared to the next two futures contracts as well as our calculation of Larry McMillan’s day-weighted average between the first and second months.
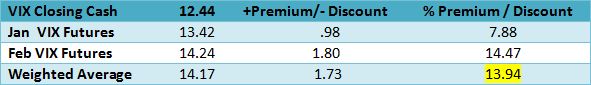
The day weighting applies 8% to January and 92% to February for an average premium of 13.94% shown above. Our alternative volume-weighted average between January and February, regularly found in the Options Data Analysis section on our homepage, is slightly lower at 11.46%. As the market advances we consider a normal premium to be between 10% -20% with a declining premium indicating a flattening term structure and more VIX Futures hedging that may end with a negative premium just as the S&P 500 Index makes a pivot and turns higher after correcting.
VIX Options
With a current 30-day?Historical Volatility?of 85.16 and 67.47 using?Parkinson’s range method, the table below shows the Implied Volatility (IV) of the at-the-money VIX calls and puts using the futures prices based upon Friday’s closing option mid prices along with their respective month’s futures prices, since the options are priced from the tradable futures.
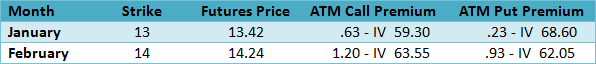
The low prices for the January options reflect their expiration on the opening Wednesday while their Implied Volatility (IV) is very close to the Historical Volatility using the range method.
All of the Implied Volatilities along with the Historical Volatilities and Greeks for the VIX options based upon the futures prices are on our?Advanced Options?page, found by clicking on the “?market close” link shown near the top of the page.
CBOE S&P 500 Skew Index?(SKEW) SKEW measures the purchase of out-of-the-money S&P 500 Index puts that require a very large downside move to profit from long put positions. An increase of this index indicates greater expectations for an extreme down move.
Now toward the upper end of the current relevant range between the November 6 low of 118.69 and the December 20 high of 143.19, it reflects more hedging activity with out-of-the-money puts by those expecting a correction.
US Dollar Index?(DX) ?After testing the lower end of its recent range on December 27, subsequent to the “taper news” on December 18, the dollar now appears to be trending higher and about to test resistance at 81.50. As crude oil production continues increasing, the US Balance of Trade and Current Account improves reducing the supply of dollars in circulation around the world, which in turn, along with higher interest rates should equate to a higher dollar and could be an important influence on continuing rotation into cyclical stocks this year.
10-Year Treasury Notes?(TNX) yield 2.82% after reaching 3.03 on December 31. The uptrend defined by the upward sloping trendline from the October 30 low of 2.47 and the December 18 low at 2.82 was decisively broken on January 10 with the disappointing December employment report that was much lower than expected. Indeed some analysts even declared it was a mistake expecting a revision higher for the January report. In the meanwhile, the trend is lower with a long way to go before resuming the uptrend.
iShares Dow Jones Transportation Average Index?(IYT) With a new closing high of 134.44 on December 15, we updated our upward sloping trendline that starts at the October 9 low of 114.49 and now touches the January 6 low at 129.11. As previously noted the transports are important since they advance early in normal market cycles. The airlines have played a significant role in the advance and expectations are high as they begin reporting 4Q earnings this week.
NYSE McClellan Summation Index?Last week our favorite breadth indicator added another 105.20 points to the previous week?s 117.86 gain for a two-week advance of 222.96 points. However, as previously mentioned, it is lower than it was on May 17 at 1193.51, when the NYSE Composite was lower, creating a divergence. We will continue watching to see if a better economy and expected outperformance by small capitalization stocks translates into better market breadth.
Strategy Idea
As for market forecasting, we suggest devoting more time to managing positions and less time studying the prognostications of popular economic and market pundits who have turned this activity into a major business enterprise. Economic predictions in particular are most dubious since they are mostly extrapolations of today’s data along with a lot of opinion to reach conclusions. We do think it is worthwhile to watch for market sector rotation as an indication of changing economic activity.
Although the S&P 500 Index is a long way above the cyclical low, the rotation into the leading transports followed by technology is encouraging. Next in line are capital goods, basic materials and then energy, which seems to suggest the current advance could continue for some time.
Since equity prices ultimately reflect earnings, following the estimates can be useful. For example, at December 31, Zacks reported S&P 500 Index earnings per share estimates for 2013 were $110 for a current price to earnings ratio of 16.72. Next, applying the dependable old Rule of 20 that says the fair trailing P/E is 20 minus inflation and using the just reported December core inflation rate of 1.7%, we get a current fair value P/E ratio of 18.30 and a fair value for S&P 500 Index of 2013.
However, since some high profile companies have missed expectations, especially in the retail sector, the current hesitation of the S&P 500 Index at the 1850 resistance level seems justified until more companies report earnings.
Zacks also reported $122 as the 2014 estimate implying a forward valuation, using the same P/E and assuming the same core inflation rate, to be 2232.60. Regardless of our somewhat disparaging comments about market forecasting above, this method does give us some guidelines to follow as earnings releases continue.
Summary
Our indicators are mostly neutral to positive with the exception of the increased SPX put-call ratio and the high CBOE S&P 500 Skew Index (SKEW) both reflect increased hedging activity that seems understandable during earnings reporting. Currently earnings seem to be the most variable, so watch to see if the S&P 500 Index can overcome resistance at 1850 as the releases continue this week. More disappointments could certainly turn the market lower leading to a long overdue correction.