Last Wednesday, after a long run from the May 3 breakout the S&P 500 Index began the inevitable overdue test of support rather dramatically, as the volume increased, the trading range expanded and the day ended in a Key Reversal.
Reviewing our market indicators, we offer some observations and speculate about how much further the pullback may go before the uptrend resumes followed by two CBOE Volatility Index? (VIX) Option suggestions as hedges.
?
Week in Review
S&P 500 Index (SPX)
Last week we cautioned a test of the breakout above 1600 could happen at some point triggered by some unexpected event and suggested watching important support at 1597.59. On Wednesday, it made a new trend intraday high and then closed lower creating a Key Reversal, a minor trend change indicator that forecasts a lower low the next day, but not the end of the primary uptrend. Valid Key Reversals require high volume with an expanding price range and this one qualified on both meeting the measuring objective Thursday with a lower low.
E-mini S&P 500 Futures (ESM3)
For further confirmation, we checked the e-mini and found it also made a contract high Wednesday before closing lower as the volume expanded from 1.7 million contracts to over 3 million as the price range expanded. Sure enough, here was another convincing Key Reversal.
CBOE Volatility Index? (VIX)
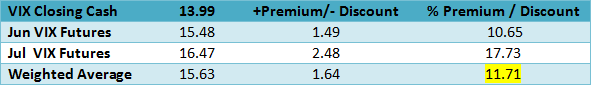
The table below shows the VIX cash compared to the next two futures contracts as well as our calculation of Larry McMillan’s day-weighted average between the first and second months.
?
?
The day weighting applies 85% to June and 15% to July for an average premium of 11.71% shown above. Our alternative volume weighed average between June and July found in the Options Data Analysis section on our homepage is slightly higher at 13.43%. Since both measures are near the middle of their normal ranges, they do not suggest any unusual activity.
When the futures term structure is in contango, or it slopes upward over time, the advantage goes to a long XIV position since it represents a short futures position as VXX continuously sells the near-term contract and buys the next longer term contract at a higher price. Friday the spread between June and July futures was -.99, while the July -August spread was -.78 as the term structure flattened suggesting higher bids.
VIX Options
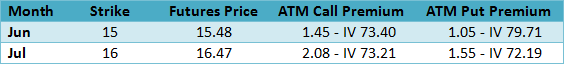
With a current 30-day Historical Volatility of 150.32 and 88.06 using Parkinson’s range method, the table below shows the Implied Volatility (IV) of the at-the-money VIX calls and puts using the futures prices based upon Friday’s closing option mid prices along with their respective month’s futures prices, since the options are priced from the tradable futures.
?
?
Using the IV Index Mean of 67.43 the IV/HV ratio is .45, using the range method for Historical Volatility the ratio is .77, as the historical volatility remains high relative to the implied volatility.
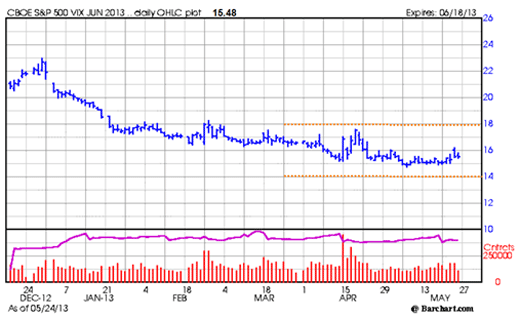
The VIX put-call ratio at 1.12 was unusually high as the result of 77,898 June 14 puts traded, which appears to be the result of put selling since their implied volatility was 69.92 compared to the June 15 puts with an implied volatility of 79.71. Since the pricing of the June options are based on the futures prices, the put sellers are speculating the futures are not likely to decline below 14. Here is the chart of the June futures with orange lines at the 14 and 18 levels.
?
?
Friday’s VIX option total volume of 405,241 contracts compares to the 5-day average of 660,810, but this includes the roll-over volume from the May contract that expired Wednesday.
The CBOE equity only put-call ratio at .73 was up from .50 the week before making it more bearish while the SPX put-call ratio at 2.12 was also higher compared to 1.40 the prior week. With extraordinarily high VIX put-call ratio of 1.12 the spread was -.39. Normally as the CBOE put-call ratio increases, it becomes more bearish, but the unusual June 14 put volume skewed the result.
CBOE S&P 500 Skew Index (SKEW)
SKEW measures the purchase of out-of-the-money S&P 500 Index puts that require a very large downside move to profit from long put positions. An increase of this index indicates greater expectations for an extreme down move. After advancing to 127.85 on Friday May 17 and then quickly declining again below the midpoint of the 113-130 range this indicator is surprisingly not reflecting concern that the market will continue declining even after the Key Reversal mentioned above.
US Dollar Index (DX)
Confirming the reestablished positive correlation with equities DX declined from 84 on the equity pullback after advancing well above the previous 83 resistance along with the equity advance until last Wednesday.
iShares Dow Jones Transportation Average Index (IYT)
Since peaking at 117.30 last Monday the transports followed the SPX and other equity indexes lower. We will be watching to see if the upward sloping trendline now about 110 will act as support on any further decline. In addition, it will be important for the transports to resume their advance when the SPX turns higher.
NYSE McClellan Summation Index
After reaching 1218.42 on Tuesday May 21, our market breadth indicator declined the last three days making the net decline for the week 75.70 points , but only .73 lower from when we last reported two weeks ago. Like the transports, watch to see if the market breadth resumes advancing when the NYSE Composite Index turns higher.
?