Well it?s that time of the year to once again ponder the old market adage and add our unique options perspective to the many comments and observations being offered by other analysts midway through this important month.
We begin with our market review and then offer two VIX hedge ideas after a few strategy thoughts to consider.
S&P 500 Index (SPX)
Last week we wrote not a lot of analysis was necessary to conclude the likely direction was higher since on a technical basis there is no overhead resistance for nervous sellers to target. Indeed the market moved higher every day except Thursday when it made a half-hearted low volume key reversal in a narrow trading range. Since we know from experience not to trust low volume key reversals we were not surprised when it did not met the next day lower low objective below 1623.09 and then went on to close at another new high. At some point, it will retest the breakout above 1600 so keep an eye on important support at 1597.59 when it occurs.
The table below shows the VIX cash compared to the next two futures contracts as well as our calculation of Larry McMillan’s day-weighted average between the first and second months.
?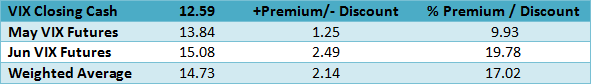
The day weighting applies 28% to May and 72% to June for an average premium of 17.02% shown above. Our alternative volume weighed average between May and June found in the Options Data Analysis section on our homepage is at bit higher at 14.82%. Both are near the middle of their normal ranges. The May Futures expire Wednesday May 22 with Tuesday May 21 the last trading day.
When the term structure is in contango, or it slopes upward over time, the advantage goes to a long XIV position since it represents a short futures position and VXX continuously sells the near term contract and buys the next longer term contract at a higher price. Friday the spread between May and June was -.1.24, while the Jun -July spread was -.1.08 as the term structure returned to normal after the recent market pull back.
VIX Options
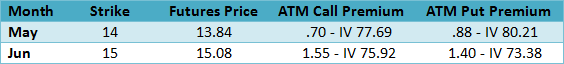
With a current 30-day Historical Volatility of 155.66 and 94.01 using Parkinson’s range method, the table below shows the Implied Volatility (IV) of the at-the-money VIX calls and puts using the futures prices based upon Friday’s closing option mid prices along with their respective month’s futures prices, since the options are priced from the tradable futures.
 ?
?
Using the IV Index Mean of 63.59 the IV/HV ratio is .41, using the range method for Historical Volatility the ratio is .68 since the historical volatility measures remain high.
The VIX put-call ratio at .11 is unusually bullish for VIX on increased call volume, but not for the SPX since they move in opposite directions. For some perspective, look at the 3 month put-call ratio chart below from our Advanced Options page. With Friday’s, call volume increase notice the ratio marked with the red arrow in the bottom right corner.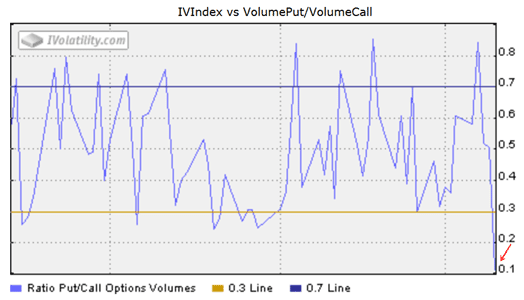
?
Friday’s VIX option total volume of 697,245 contracts compared to the 5-day average of 427,560 with much of the increase due to call volume. While there are numerous quick declines below the .3 level this one is the lowest in the last year. The increase in VIX call volume suggests more hedging as the S&P 500 Index closed at another new high.
The CBOE equity only put-call ratio at .59 was down from .61 the week before making is slightly more bullish, but VIX put-call ratio of .11 was more bearish making the spread .48. As the CBOE put-call ratio declines it becomes more bullish while the VIX put-call ratio is more bearish (for the SPX) as the ratio declines making the spread between them wider.
CBOE S&P 500 Skew Index (SKEW)
SKEW measures the purchase of out-of-the-money S&P 500 Index puts that require a very large downside move to profit from long put positions. An increase of this index indicates greater expectations for an extreme down move. Now below the midpoint of the 113-130 range this indicator is not reflecting concern for a market decline any time soon.
US Dollar Index (DX)
The advances made Thursday and Friday along with declines in the 10-Year Treasury Notes and 30-Year Treasury Bonds confirm more “risk on” activity. However, we note it stalled at this level last summer. Further advances would be bullish for equities according to the positive correlation theory proposed in Digest Issue 11.
iShares Dow Jones Transportation Average Index (IYT)
Last week we said IYT needed to close back above the March 19 high of 112.30 to confirm the new high in the Dow Jones Industrial Average and it came last Monday with a close at 112.49, up 1.51 on the day. From a Dow Theory perspective they are now back in harmony. With the new highs, we have redrawn our upward sloping trendline touching the April 15 low at 104.87 with multiple subsequent points on the new rising trendline.
NYSE McClellan Summation Index
Like the iShares Dow Jones Transportation Average Index above the bulls received more encouragement as the market breadth continued advancing up another 228.73 points in addition to the previous week’s 165.66 gain, taking the index back above 1055.43 where it stalled last February. Expanding breadth suggests rotation from defensive “bond like equities” such as Utilities, Consumer Staples and Health Care into more cyclical “risk on” stocks.