Will Natural Gas Price Rally Hurt Demand?
???? Today’s Spotlight Market
The front-month Natural Gas futures contract has run into some headwinds in its move to test chart resistance at the 4.500 price level. In addition to data suggesting that higher Gas prices may be causing power producers to switch to cheaper coal for running power generators, the weekly Energy Information Administration’s (EIA) Gas storage report released on Thursday showed that U.S. Gas Storage rose by a larger than expected 43 billion cubic feet (bcf), versus the 30 bcf injection expected by traders.
This bearish news caused the lead-month June futures to fall by over 7% after the figures were released. Speculators have finally started to move from a net-short position in Natural Gas to a net-long position after nearly 5-years of a vicious bear market for prices. However, we may need to see a continued stream of bullish data to convince these newly found Gas bulls that the rise in prices will hold.
???? Fundamentals
Although it appears that commodity prices are in the midst of a bear market cycle, Natural Gas prices are bucking this negative price trend, with prices for the lead-month futures contract trading near its highest level since July of 2011. Colder weather this winter saw increased Gas usage for heating, which helped to alleviate the huge surplus of Natural Gas in storage. Gas in storage is running nearly 7% below the 5-year average for this time of yea, and over 30% below last year’s totals.
Electric producers have been switching away from coal and moving increasingly towards Natural Gas as the fuel of choice for power production the past few years, as environmental constraints and cheaper prices favored Natural Gas as a fuel source. However, the sharp price gains seen in Gas prices this year are starting to make coal appear to be a more attractive fuel source for some power suppliers.
April’s coal usage by power plants rose 13%, while Natural Gas usage fell by 11%. It may be too early to confirm that is the start of a trend towards lower Gas usage, but we are certainly seeing signs that end users may reduce Gas usage if prices rise sharply compared to alternative fuel sources.
???? Technical Notes
Looking at the daily continuation chart for Natural Gas futures, we notice that prices have moved upward in fits and starts since major lows were made back in April of 2012. Prices have recently slipped from 21-month highs, but remain well above long-term support levels seen near the 3.450 price area. There is a bearish divergence forming on the 14-day RSI, which might be signaling that, at a minimum, a short-term price correction may be forthcoming.
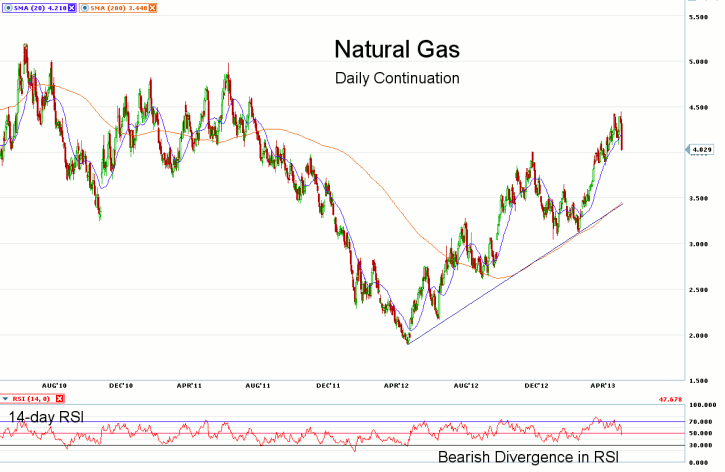
After reaching overbought levels above 70.00, the 14-day RSI has turned neutral to weak, with a current reading of 47.67. Near-term support is seen at the psychological 4.000 price level, with chart support not seen until the April 4th low of 3.861. Near-term resistance is seen at the recent high of 4.444, with longer-term resistance found near the 5.000 level.
Do you want to learn about unusual options trading activity? Then the Unusual Options Activity Forum is for you:
When: Wednesday, May 15
Time:? 2:00 p.m.
Where: The Chicago Board Options Exchange, 400 South LaSalle Street, Chicago, IL 60605
Price: $99
What Will You Learn?
Attendees of this one-of-a-kind event will learn:
- The specific tools, strategies, and techniques used by options experts to identify unusual options trading activity
- How to filter out meaningful trades from the sea of noise in the options market
- How to successfully incorporate unusual activity information into your options trading
- How to avoid the costly mistakes made by many traders when analyzing unusual options activity.
What Will You Get?
- A Rare, Guided Tour of the Historic Chicago Board Options Exchange Trading Floor ? Including the Apple, Google, SPX & VIX Trading Pits (street price: unavailable to the public)
- One Free Month of Option Vision ? ?A unique 3-D charting platform designed to hunt down unusual options activity (street price: $99)
- One Free Month of OptionAlert ? The leading option flow monitor and unusual activity analysis tool (street price: $150)
- One Free Month of Livevol Pro ? The premiere analytics platform for professional options traders (street price: $199)
- Free Copy of The Options Traders? Hedge Fund (street price: $40)
- One Free Month of Option Pit Live ? Option Pit Live is designed to feed option traders the best actionable options trading content on the web. (street price: $125)
- One Free Month of Market Taker Group Coaching ? Let the pros at Market Taker Mentoring improve your options trading. Receive professional daily group mentoring sessions for one month ? including 20 trade ideas each session. (street price: $332)
———————————————————————————
Disclaimers
This article is provided for informational purposes only. No statement in this article should be construed as a recommendation to buy or sell a security or to provide investment advice. The content provided has been obtained from sources deemed reliable but is not guaranteed as to accuracy and completeness. optionsXpress makes every effort to provide timely information to its recipients but cannot guarantee specific delivery times due to factors beyond our control.
Derivatives involve substantial risk and are not appropriate for all investors. Please read the “”Disclosure Statement for Futures and Options”” prior to investing in futures or options.
For investments using a straddle or strangle options strategy the potential loss is unlimited. Multi-leg option strategies are subject to multiple commissions. Profits may be eroded by the commission expended to open and close the positions and other risks apply.