On its 40th anniversary last Friday the listed options industry and the Options Clearing Corporation marked the occasion at the Options Industry Conference in Las Vegas by highlighting the first day volume on April 26, 1973 totaled 911 contracts. Compare that to last Friday’s volume of 15,181,128 contacts, forty years later.
This week we update our market indicators and report on the status of the potential Head & Shoulders Top formation previously identified. Then we update our recent iShares Russell 2000 Index (IWM) hedging suggestion followed by a progress report on a previous iShares MSCI Japan Index (EWJ) suggestion.
S&P 500 Index (SPX)
Last week we thought a potential right shoulder of a developing Head & Shoulders Top was likely as SPX advanced back up toward 1574, but it continued higher destroying the pattern symmetry and greatly reducing the chances. Now look for close above the April 11 high of 1597.35 for confirmation the long-term uptrend will continue.
E-mini S&P 500 Futures (ESM3)
Last week, we also expressed concern about the continuing decline in open interest since it meant the uptrend had become unstable. However, through last Thursday the five-day net open interest gain was 60,923 contracts as the longs returned in force dramatically changing the balance to the upside once again.
The table below shows the VIX cash compared to the next two futures contracts as well as our calculation of Larry McMillan’s day-weighted average between the first and second months.
?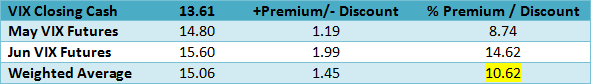
The day weighting applies 68% to May and 32% to June for an average premium of 10.62% shown above. Our alternative volume weighting between May and June is fractionally higher at 11.09% putting both near the middle of the normal range.
iPath S&P 500 VIX Short Term Futures ETN (VXX)
After quickly advancing on the market pull back, it looks as if the downtrend continues for this hedging favorite as the volume declined from a five-day average of 97.3 million shares the week before to a more normal weekly level of 46.7 million.
VelocityShares Daily Inverse VIX Short Term ETN (XIV)
The 5-day average volume for the inverse was 14.2 million shares down from 25.7 the week before making the VXX/XIV volume ratio 3.28 compared to 3.78 the week before and 2.93 in Digest Issue 15.
When the term structure is in contango, or it slopes upward over time, the advantage goes to a long XIV position since it represents a short futures position and VXX continuously sells the near term contract and buys the next longer term contract at a higher price. Friday the spread between May and June was -.80, while the Jun -July spread was -.75 both somewhat lower than normal suggesting the term structure is still flatter than normal after the recent market pull back.
VIX Options
With a current 30-day Historical Volatility of 169.30 and 105.26 using Parkinson’s range method, the table below shows the Implied Volatility (IV) of the at-the-money VIX calls and puts using the futures prices based upon Friday’s closing option mid prices along with their respective month’s futures prices, since the options are priced from the tradable futures.
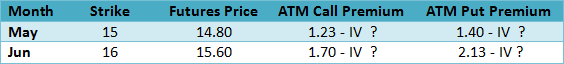
Since there were system problems at the CBOE Thursday, our implied volatility calculations normally shown above are unavailable. Using the IV Index Mean of 99.33 the IV/HV ratio is .59, using the range method for Historical Volatility the ratio is .94.
The VIX put-call ratio at .30 is bullish for VIX, but not for the SPX since they move in opposite directions.
The CBOE equity only put-call ratio at .65 was down from .85 the week before making is slightly more bullish the VIX put-call ratio of .30 was more bearish making the spread .35. As the CBOE put-call ratio declines it becomes more bullish while the VIX put-call ratio is more bearish (for the SPX) as the ratio declines making the spread between them wider.
CBOE S&P 500 Skew Index (SKEW)
SKEW measures the purchase of out-of-the-money S&P 500 Index puts that require a very large downside move to profit from long put positions. An increase of this index indicates greater expectations for an extreme down move. Now just below the midpoint of the 113-130 range and declining this indicator does not reflect concern that the recent market pull back is likely to continue.
US Dollar Index (DX)
With a somewhat weaker than expected preliminary GDP report the dollar seems to have stalled just under 83 near where it turned lower last summer, however the positive correlation theory proposed six weeks ago appears to be holding as the dollar advanced again along with equities last week.
iShares Dow Jones Transportation Average Index (IYT)
In addition to being an important Dow Theory confirming indicator, the transports deserve close attention as a leading economic indicator. Two weeks ago, we said the transports were right on the long-term upward sloping trendline but since declined below on the market pull back lagging the S&P 500 Index. With its sensitivity to the economy, we continue to suggest checking the transportation index before making any market direction decisions.
NYSE McClellan Summation Index
Since our last market review two weeks ago, the breadth indicator declined another 42.58 points, but turned better by 95.03 last week. The lagging breadth divergence continues to be a concern since it demonstrates concentration in fewer large capitalization stocks, those with good liquidity and dividend support consistent with defensive positioning now referred to as “bond like equities.”