One of the things most options traders watch is what the VIX curve looks like. ?It’s not just the overall shape that matters, it’s how steep the curve is, much like skew. ?Last month at this time, the VIX was trading at 13.7. ?The Feb future was trading 14.35, a premium of about 5% to VIX cash. ?This is about normal, and points toward a market that is somewhat efficient and comfortable with VIX levels. ?The VIX futures ended up settling 13.07.
Today, the VIX settled 12.25, while the VIX future settled 13.20, a premium of near a full point. ?This is a premium to cash of closer to 10% than 5%. ?In fact, the enter curve is trading at huge percentage premiums relative to the norm. ?You can see the two curves next to each other below.
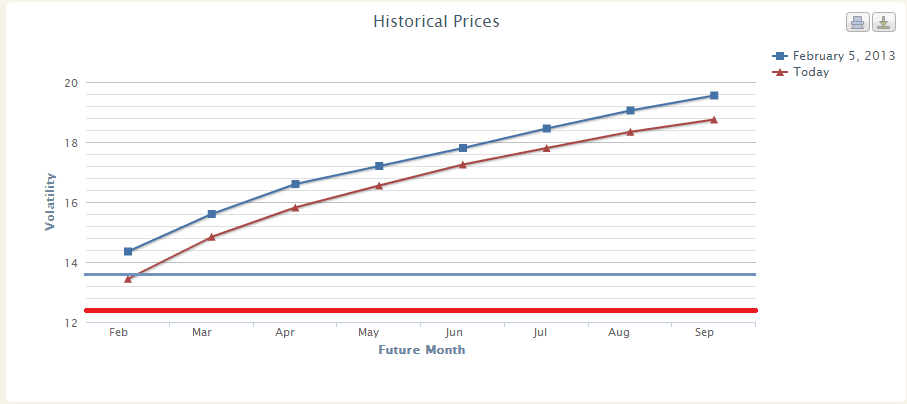
What does this steepness in the curve mean? Russell Rhoads of the CBOE wrote a nice piece on yesterday’s VIX close yesterday. ?A steep curve points toward a hedge market. ?Thus, I think the market will continue to run, and while the VIX could rally to 13 and we could see the Cash and Future converge, I highly doubt that happens. ?I think VIX will trade somewhere next 12-12.5 for the next week and the future is going to continue to drop. ?I would absolutely put my money down on a below 13 settle for March.
The Trade:
With contango this steep, a short VXX position, or short April VIX position could perform very well over the next few days.
Option Pit will be giving a webinar on how to use OptionVision to help spot order flow and build positions accordingly.? Click this link to register:??Option Pit “Using orderflow to trade options”
If you want to learn what all this means- ?This is the type of information we will train you to analyze in our?gold course. ?If you needed help following this trade, you should be in that course. ?Call us at 888 Trade 01 and ask for Taylor. ?Anna is leaving us and we wish her all the best.