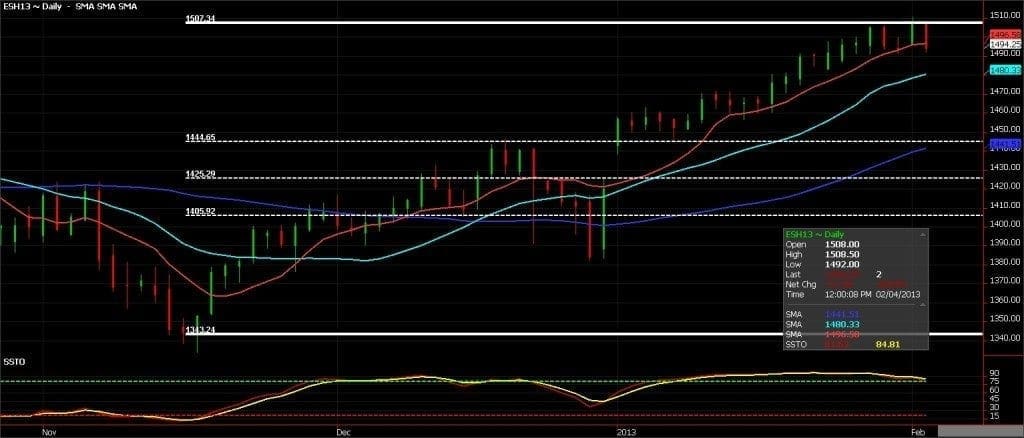
In the last two and a half months, the S&P has advanced 12% lifting prices to five year highs above 1500 in March futures. As one can see it has been a steady climb for all of 2013 as prices have been able to dance above the nine day MA; identified by the red line in the chart above. I have been anticipating a correction now for several weeks. It is way too early to call an interim top but if we are able to close below this pivot point it could be the start. As one can see prices have reached overbought levels. On a correction lower I think it is vey feasible to see a trade to the 38.2% Fibonacci level. This would put prices just above the 50 day MA; identified by the dark blue line. Along the way I have advised clients to be short and hedge their position with put options. I have taken a profit on the put options and now look to recoup value on the futures leg on the way down.
I will be the first to admit that I made two mistakes on this trade?letting a winner become a loser and holding on for too long. On a trade back near 1425-1440 in March futures it would amount to a small loss for clients that weathered the storm. ?Two takeaways?don?t allow winners to become losers and regardless of your opinion cut losses when a trade moves array.
Turmoil overseas, negative earnings, weaker economic numbers or even just traders booking profits could serve as a catalyst to get indices moving lower short term. We do not need to see a bear market but rather a routine correction for traders to dodge a bullet on this trade.