I like to use this forum to address some common student questions that I hear. In our courses, we teach students how to identify the highest probability zones in which to enter or exit trades. These supply and demand zones need to meet certain criteria to ensure they offer low risk and high probability for the trader?s success.
As educated traders, we only want to trade fresh zones. Of course in our search for the fresh demand or supply zones, my students inevitably will ask, ?How far back do I need to look to make sure the level is fresh??
I usually make an analogy to the old Etch-A-Sketch toys. When you were done making your drawing and wanted to start something new, you would shake the toy and erase whatever drawing was on your screen. With price, we want to look back to see where the price level in question (the supply or demand), was not a concern for traders. It was not necessarily erased from their memories, but was not a level of concern yet.
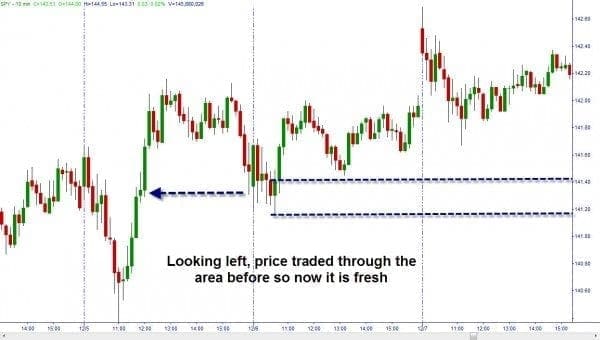
This is shown on the charts from price having traded through that particular level in the past. When we look left on our charts, if we see that if price has traded through the zone before it was established, then it is now a fresh zone.
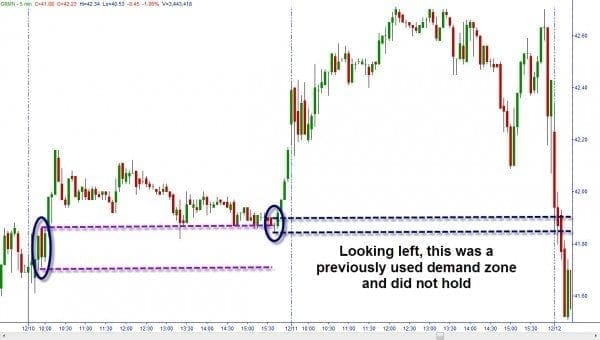
However, if we can find that there is a turning point that qualifies as supply or demand in the same level as the current zone, then the current one is not fresh and is not one that we should use for trading.
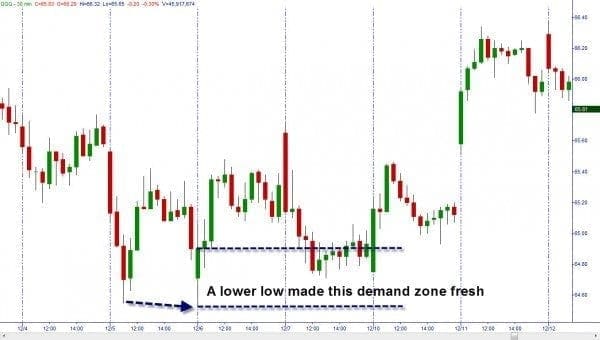
An interesting question is: ?What happens if the current zone is close to a previous one but has made a new low or new high?? ?The new high or low shows the point of equilibrium between buyers and sellers has moved and therefore a new supply or demand zone has now been established.