Everyone knows that implied volatility and stock returns tend to be negatively correlated. The results from a recent study we did showed, though, that when implied volatility and stock returns?become too negatively correlated, volatility sellers should consider moving to cash.
The x axis in fig. 1 shows the two month realized correlation of VXX and SPX returns. The y axis shows VXX returns 15 days after each correlation observation. One thing that stands out from this?plot is that, if we only take the returns where two month correlation is -0.90 or higher, we lop off most of the VXX upside.
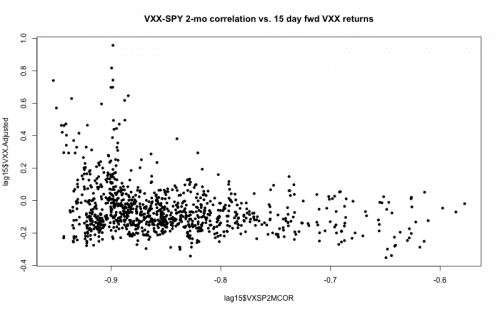
Fig. 1. VXX-SPY 2-month realized correlation and 15-day forward VXX returns. Source: Condor Options
For volatility sellers, then, the idea to be tested is to be short VXX most of the time, but to move to cash when realized correlation to SPY falls below -0.90. Fig. 2. shows the equity curve of a short VXX?strategy with and without the correlation filter.
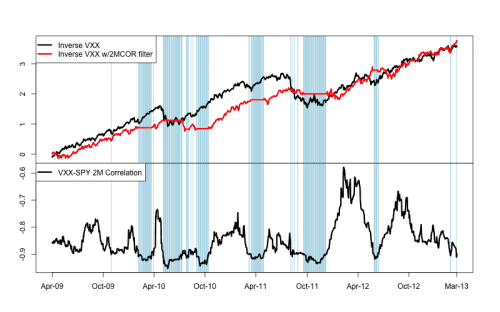
Fig. 2. Inverse VXX and correlation filter. Source: Condor Options
You can see that the inverse VXX strategy with a correlation filter (red) reduced drawdowns while achieving the same total return as the unfiltered version (black).
For the curious: taking a long VXX position instead of moving to cash was a worse approach ? it didn?t improve performance significantly on the upside and created larger drawdowns.
There are plenty of caveats here.
- A four year sample isn?t very much data, and the fact that there are just five or six clusters of correlation < -0.9 mean we?re really just looking at the effects of a few trades.
- Why should excessive realized correlation matter, intuitively? The easy answer is that maximal VXX-SPY inverse correlation indicates excessive investor sentiment, or something: fewer ?stocks up / vol down? sessions would be typical, on this view, of the ?wall of worry? that fuels sustainable gains. But that?s just conjecture. It?s also possible that daily return correlation is duplicative of some more fundamental factor.
- The data in question also cover a period where equity implied vol was moving from very high to very low absolute levels. Extreme correlation might mean something else in a different regime.
So I wouldn?t suggest using these correlation levels independently to motivate a strategy, but this test does raise some questions about the relationship between equity returns and implied volatility.
Disclosure: VXX and SPY positions at the time of writing.