Top 5
In the “Rankers and Scanner” section of our home page we feature a complimentary ranker sample at the “Top 5 stocks by implied volatility change” link. With a click, you go to an Advanced Ranker Sample of the top and bottom 5 stock in four categories. For ideas, we often look at the Top 5 stocks based on the Implied Volatility Index Mean vs. the 30-day Historical Volatility (IV Index Mean vs. 30D HV). From Friday, here are the results.
|
Stock symbol (Company name) |
IV Index Mean |
30D HV |
IV Index / HV ratio |
|
412.47% |
86.81% |
4.75 |
|
|
13.50% |
6.36% |
2.12 |
|
|
39.98% |
19.95% |
2.00 |
|
|
60.72% |
31.45% |
1.93 |
|
|
86.90% |
47.08% |
1.85 |
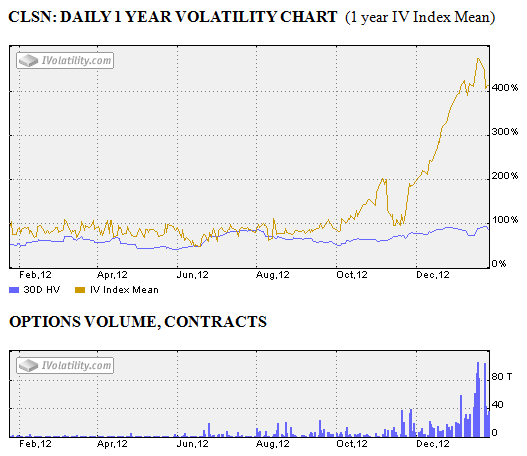
Number one with a ratio of 4.75 we have CLSN accompanied by its volatility chart.
First introduced last year, Celsion Corporation (CLSN) is awaiting an FDA announcement expected in late January. With the high-implied volatility for the February options, a one standard deviation move is between 1.76 and 12.73. As could be expected from the IV, some think the stock could go to zero while others say it will be 40 on the announcement. We should know the results soon.
PowerShares DBA Agriculture Fund (DBA)
DBA is in second place. Since indexes and ETF’s are less volatile than individual equities as indicated by a 30-day historical volatility of 6.36%, and even a bit less using the range method at 6.17%, the implied volatility looks interesting. Since it is in a well-defined downtrend an out-of-the-money call credit spread is one idea, but the options volume is low so liquidity will be an issue.
LinkedIn Corp. (LNKD)
Currently in a well-defined uptrend with a decent options volume, this appears to be an earnings story since they are reporting 4Q Thursday January 31 with a consensus estimate of .19 per shares and whisper of .22 per share. Watch for a decline in implied volatility on the earnings report.
Constellation Brands Inc. (STZ)
After breaking out to the upside of the recent range on an upgrade after the last earning report of .63 per share along with raising guidance this wine and beverage company is trending higher. A short put or a long call spread with a short put are two ideas to consider.
Green Mountain Coffee Inc. (GMCR)
Scheduled to report 1Q earnings on February 6, Green Mountain is one of our Volatility Kings and we are expecting to see higher implied volatility before the reporting date. They recently raised guidance and reports that Starbucks competitive Verismo coffee maker sales results have been “clearly underwhelming” to date are helping boost the stock as it closed above 45. Since they have already raised guidance, an earnings surprise seems unlikely so a volatility calendar spread, short the near term option, long the deferred is one possibility.
Calendar Spread
iShares Russell 2000 Index (IWM) 89.94.
Although the timing is unknown, Dan Sheridan at Sheridan Options Mentoring is also in the correction camp. Here are his instructive thoughts and ideas for IWM.
Calendars and the confusing Implied Volatility of a spread concept
Proposed IWM trade: Buy 1 March 90 put at 2.13 and sell 1 February 90 put for 1.31, net debit .82.
It seems straightforward so far. Calendars seem like a good idea from an implied volatility perspective in IWM because implied volatilities are at the lowest levels in 5 years. Because IWM (baby RUT) is at 5-year highs, we should be backing off, but who knows when? Because of price level concerns, I would trade half my calendar size at trade initiation. Then, whichever way it moved I would add an additional calendar and turn the trade into a double calendar. For example, if I normally do 10 calendars, I would start with 5. If IWM moved up next week to around 92, I would add 5 calendars at the 92 strike. If IWM moved down next week to 88, I would add 5 more calendars. In both cases, I would be turning my original single calendar into a double calendar.
Teaching time: Implied volatility level of a spread. The implied volatility of the long option in this calendar trade is 16.30 and the short option is 15.30. If I ask you for the implied volatility of each option, that?s easy. But what if I say, what is the implied volatility level of the spread? If I buy an option with 16.30 volatility, and sell another with 15.30 volatility, what one volatility number represents the implied volatility of the spread? Tougher, isn’t it? A rough and tumble way to figure it out is to take the difference in implied volatility levels of the two options, for this example 1, and add it to the implied volatility of the long option, 16.30 to get 17.30. This is a more accurate level of the implied volatility of the spread. In the current extreme low volatility environment we are in, negative skews, called Contango are normal. They exist most of the time, especially in an upward trending market. Dan, what do you mean? A negative skew exists when the option volatility of the short option in a calendar is less than the implied volatility of the long option. In our proposed trade, the negative skew is 1 point since the short option implied volatility is 1 point less than the long. I think even an implied volatility level of 17.30 for the spread is reasonable but I might put the Calendar trade in at .80 because I think the negative skew is extreme.
Conclusion: I would enter this trade at-the-money for around .80 (.02 cents cheaper than proposed price) and turn it into a double Calendar once IWM moves either up or down. The implied volatility of a spread is important to get an accurate reading on the implied volatility of a Calendar.
The suggestion above uses the closing middle price between the Friday bid and ask. Monday, the option prices will be somewhat different due to the time decay over the weekend and any price change.
Summary
While we all know a correction to test the previous resistance will occur, the timing along with triggering news or unbalancing forces is yet to be determined. It could occur on the upcoming employment report or the market could continue higher for some time, but for now correction predictions, are just guesswork.

